Deep dive into AI agent observability with Microsoft Agent Framework - tracing with open-source tools Aspire Dashboard and Langfuse
Tracing AI agents via Aspire Dashboard and Langfuse: a quick developer view, anonymization through the collector, and specialized AI observability.
In the first part we covered the basic architecture and reasons why I like to use the OpenTelemetry collector, so that last time we could focus on metrics and their use in Azure Monitor for Prometheus and Azure Managed Grafana. Today we dive into tracing, the most important discipline for AI agent observability, and we start with open-source tools: Aspire Dashboard for a quick developer view and Langfuse.
Open-source tracing for AI agents
OpenTelemetry is eating the observability world and I am a huge fan. After many years of combining proprietary tools and approaches with an alternative open-source SDK zoo, OpenTelemetry arrived with an ambition to unify metrics, logs, and tracing under a single protocol, single SDK and API. There are numerous backends that provide visualizations and data persistence, but for quick developer assessments they are all cumbersome, slow, expensive, or consume too many resources. That is why the .NET team developed Aspire Dashboard, a simple solution running in a single lightweight container where you can visualize OpenTelemetry quickly and nearly in real time.
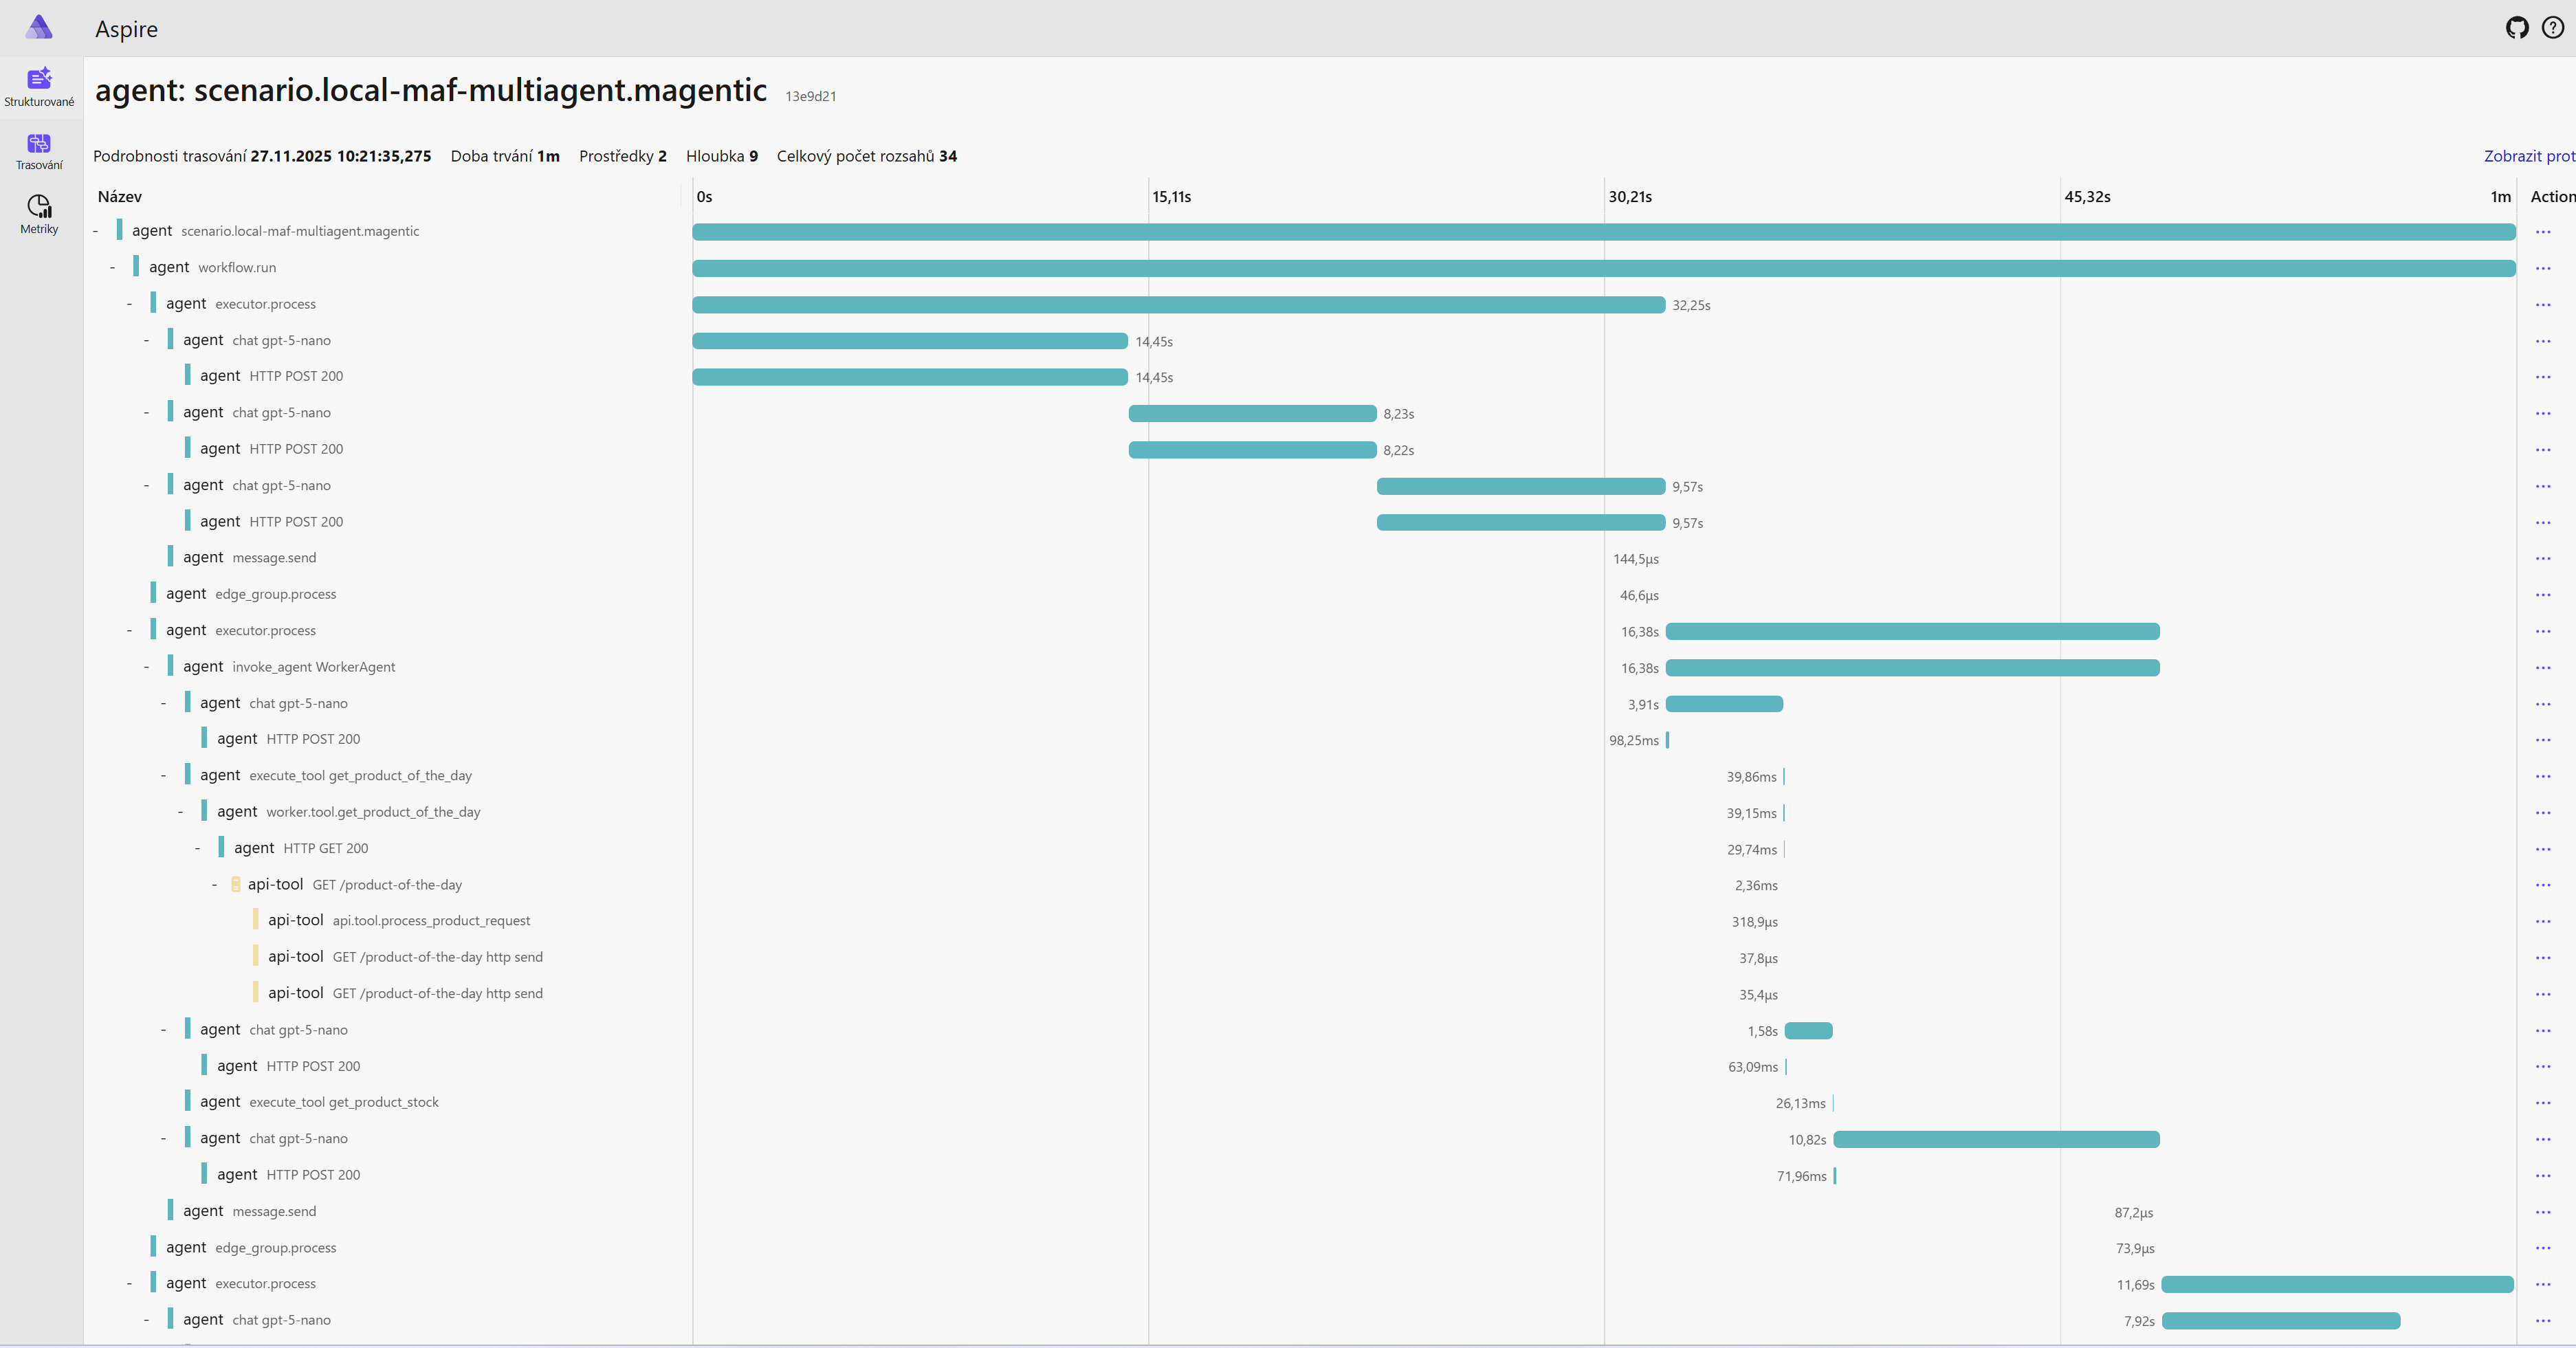
Here we can see tracing from a multi-tenant Magentic-style solution in Microsoft Agent Framework.
Trace overview in Aspire Dashboard
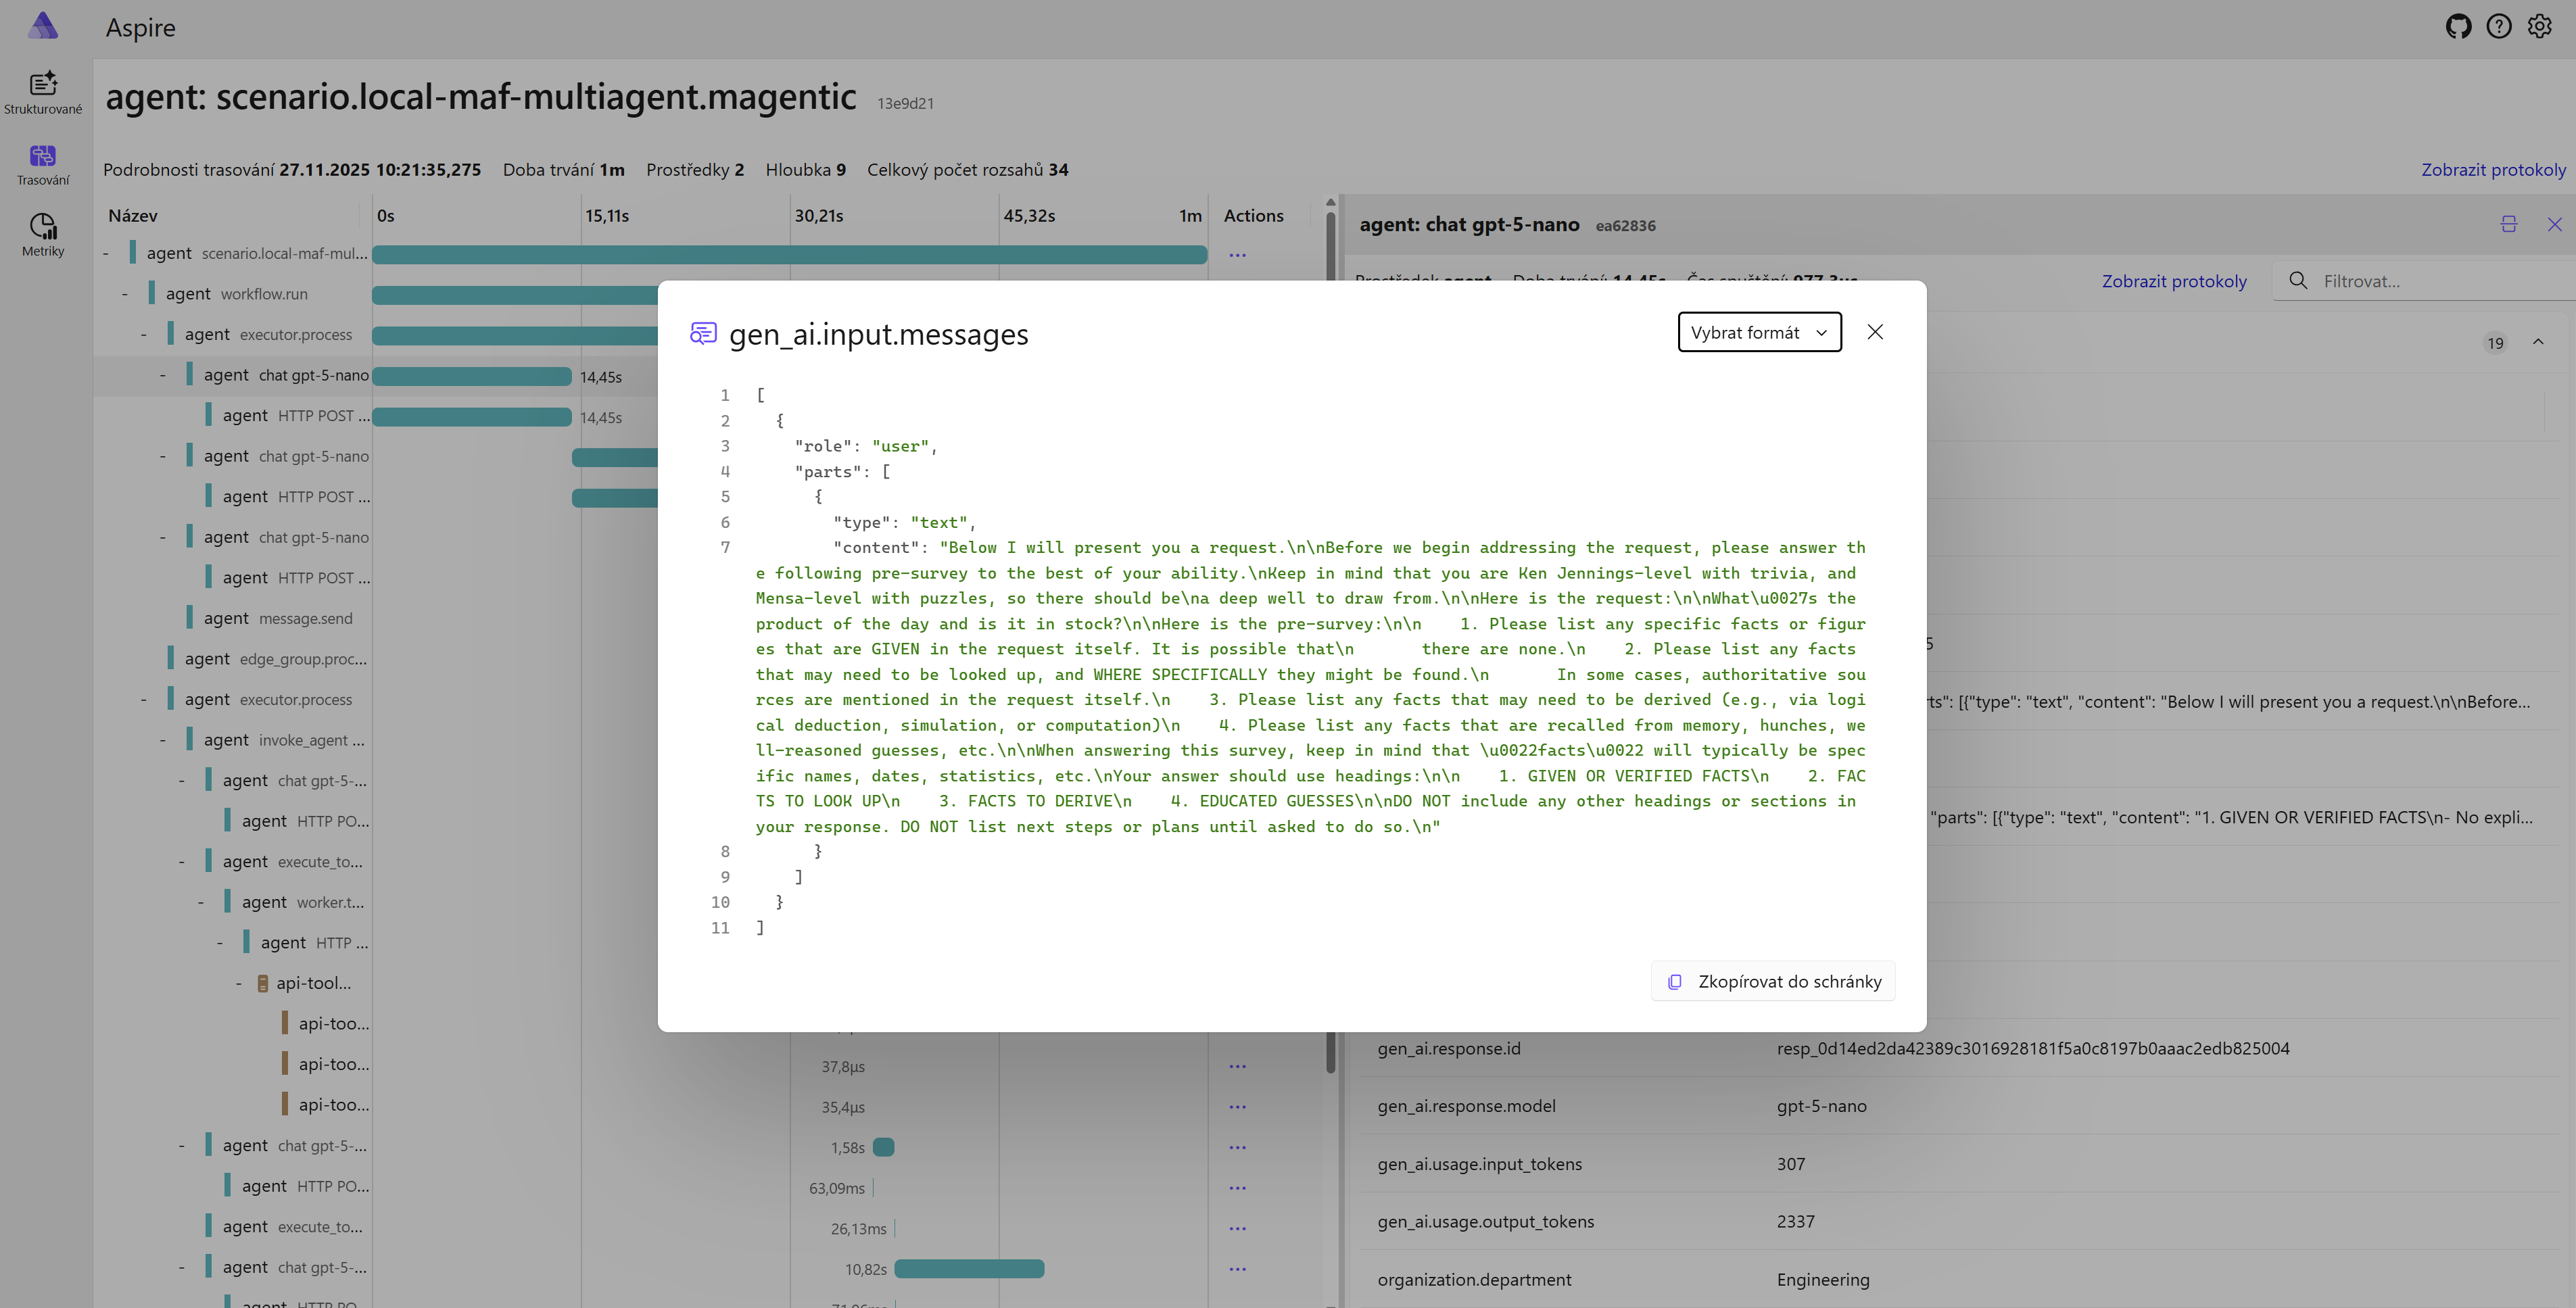
In my case I also enabled logging of individual messages and responses.
Texts and responses in an Aspire trace
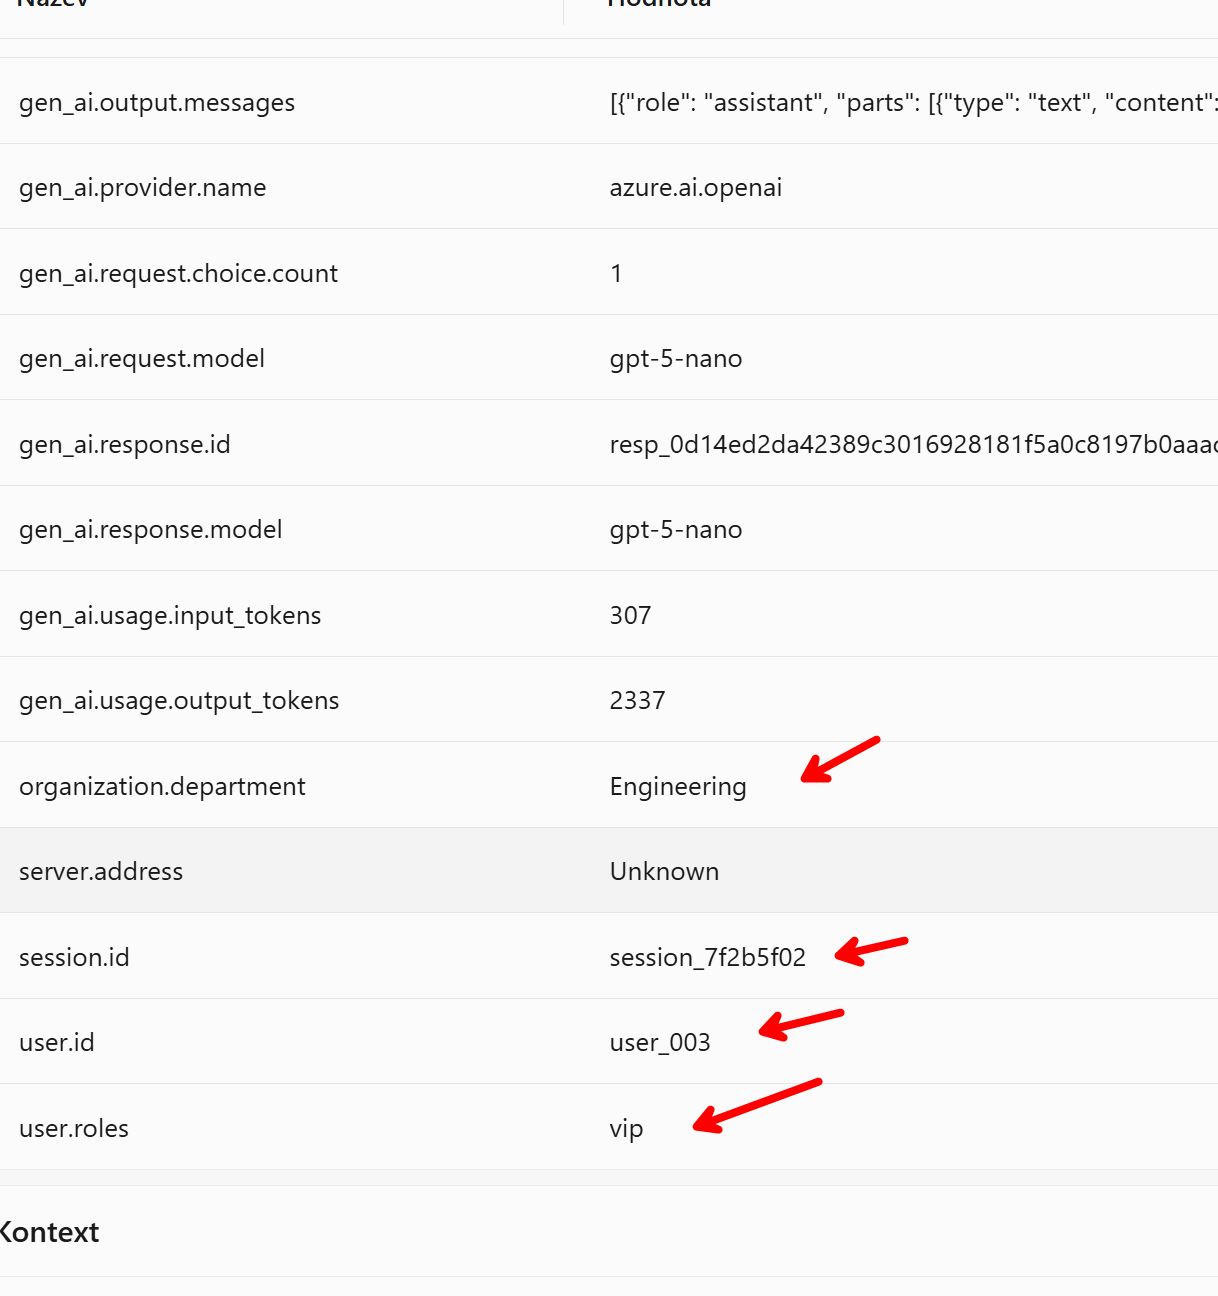
I also collect custom attributes, such as session ID, logged-in user, user roles, department, and so on.
Custom attributes in Aspire Dashboard spans
As you can verify in the first part of this series, my OpenTelemetry collector is configured to filter certain fields and hash others, thereby masking the original information. I have created another Aspire instance to which the OTEL collector sends filtered and anonymized information. Notice that I have no conversation content at all, the user ID is masked, but I still have the necessary technical information such as timings and token consumption.
Anonymized Aspire view without conversation content
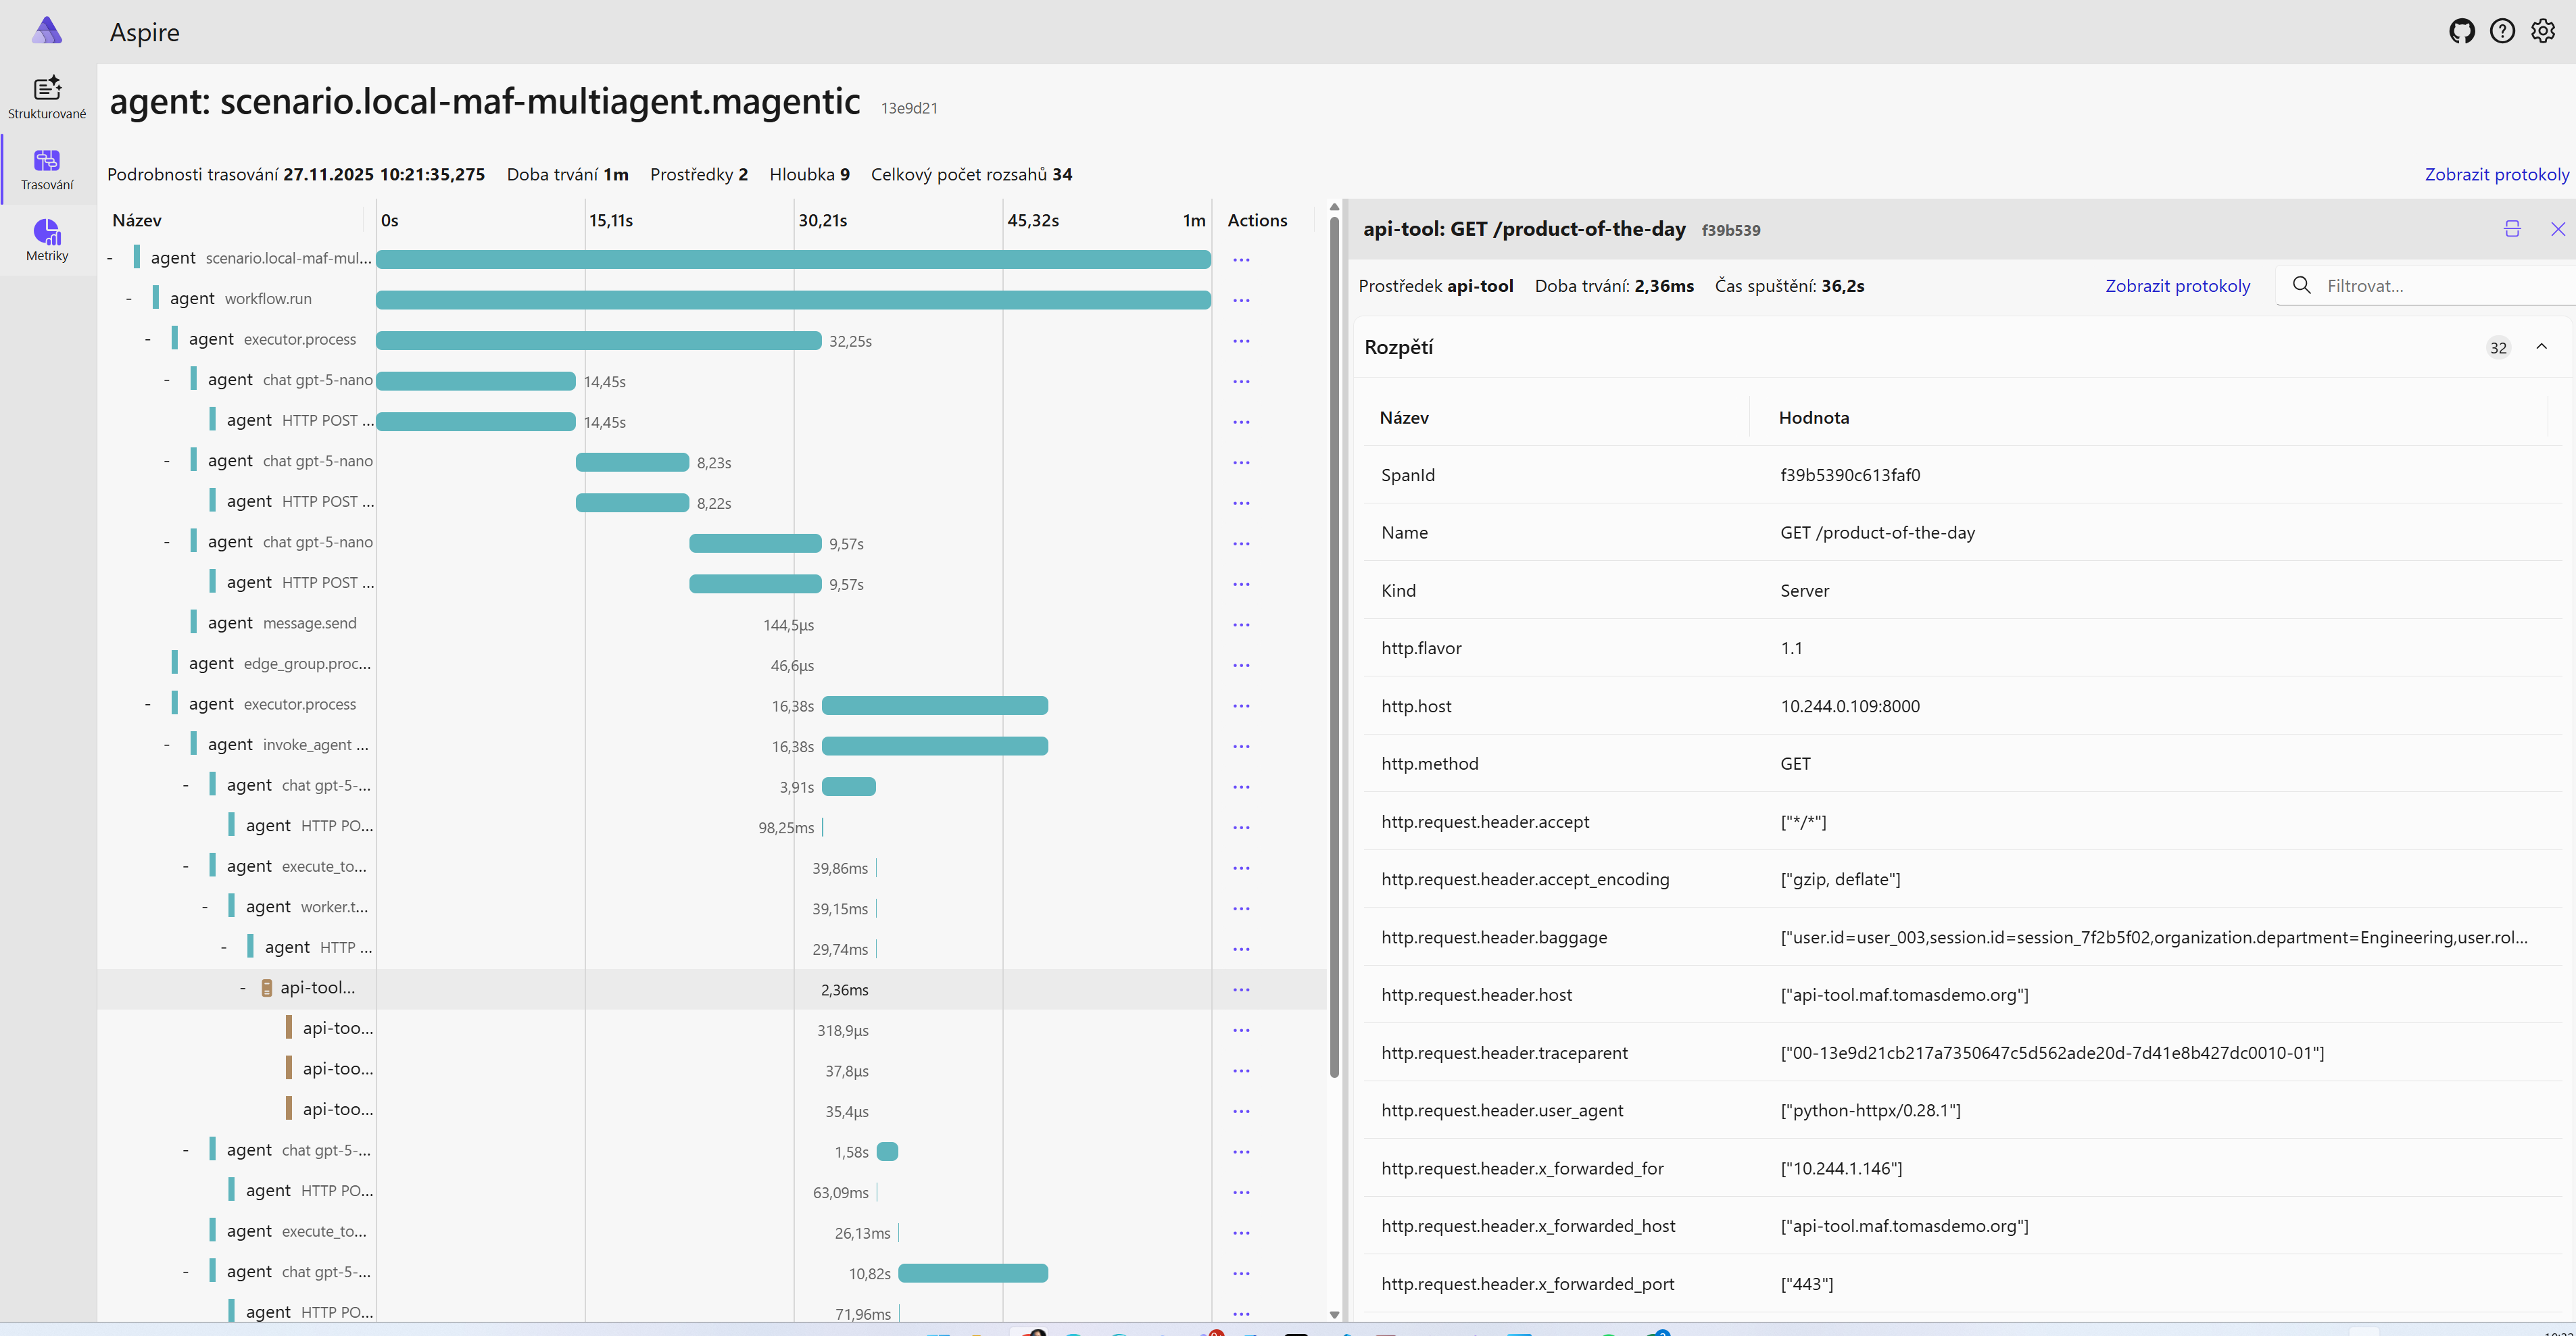
This is what a tool call looks like.
Tool call detail in an Aspire trace
For quick monitoring data snapshots, Aspire Dashboard is excellent - simple, tiny, fast.
Looking for a tracing tool that is open-source and specifically specialized for AI scenarios? Langfuse is very popular, but unfortunately even it is not fully open in terms of project governance (it is not under CNCF, Apache Foundation, or Linux Foundation) and is more of an MIT core. Nevertheless it is a very good solution, so let's take a look.
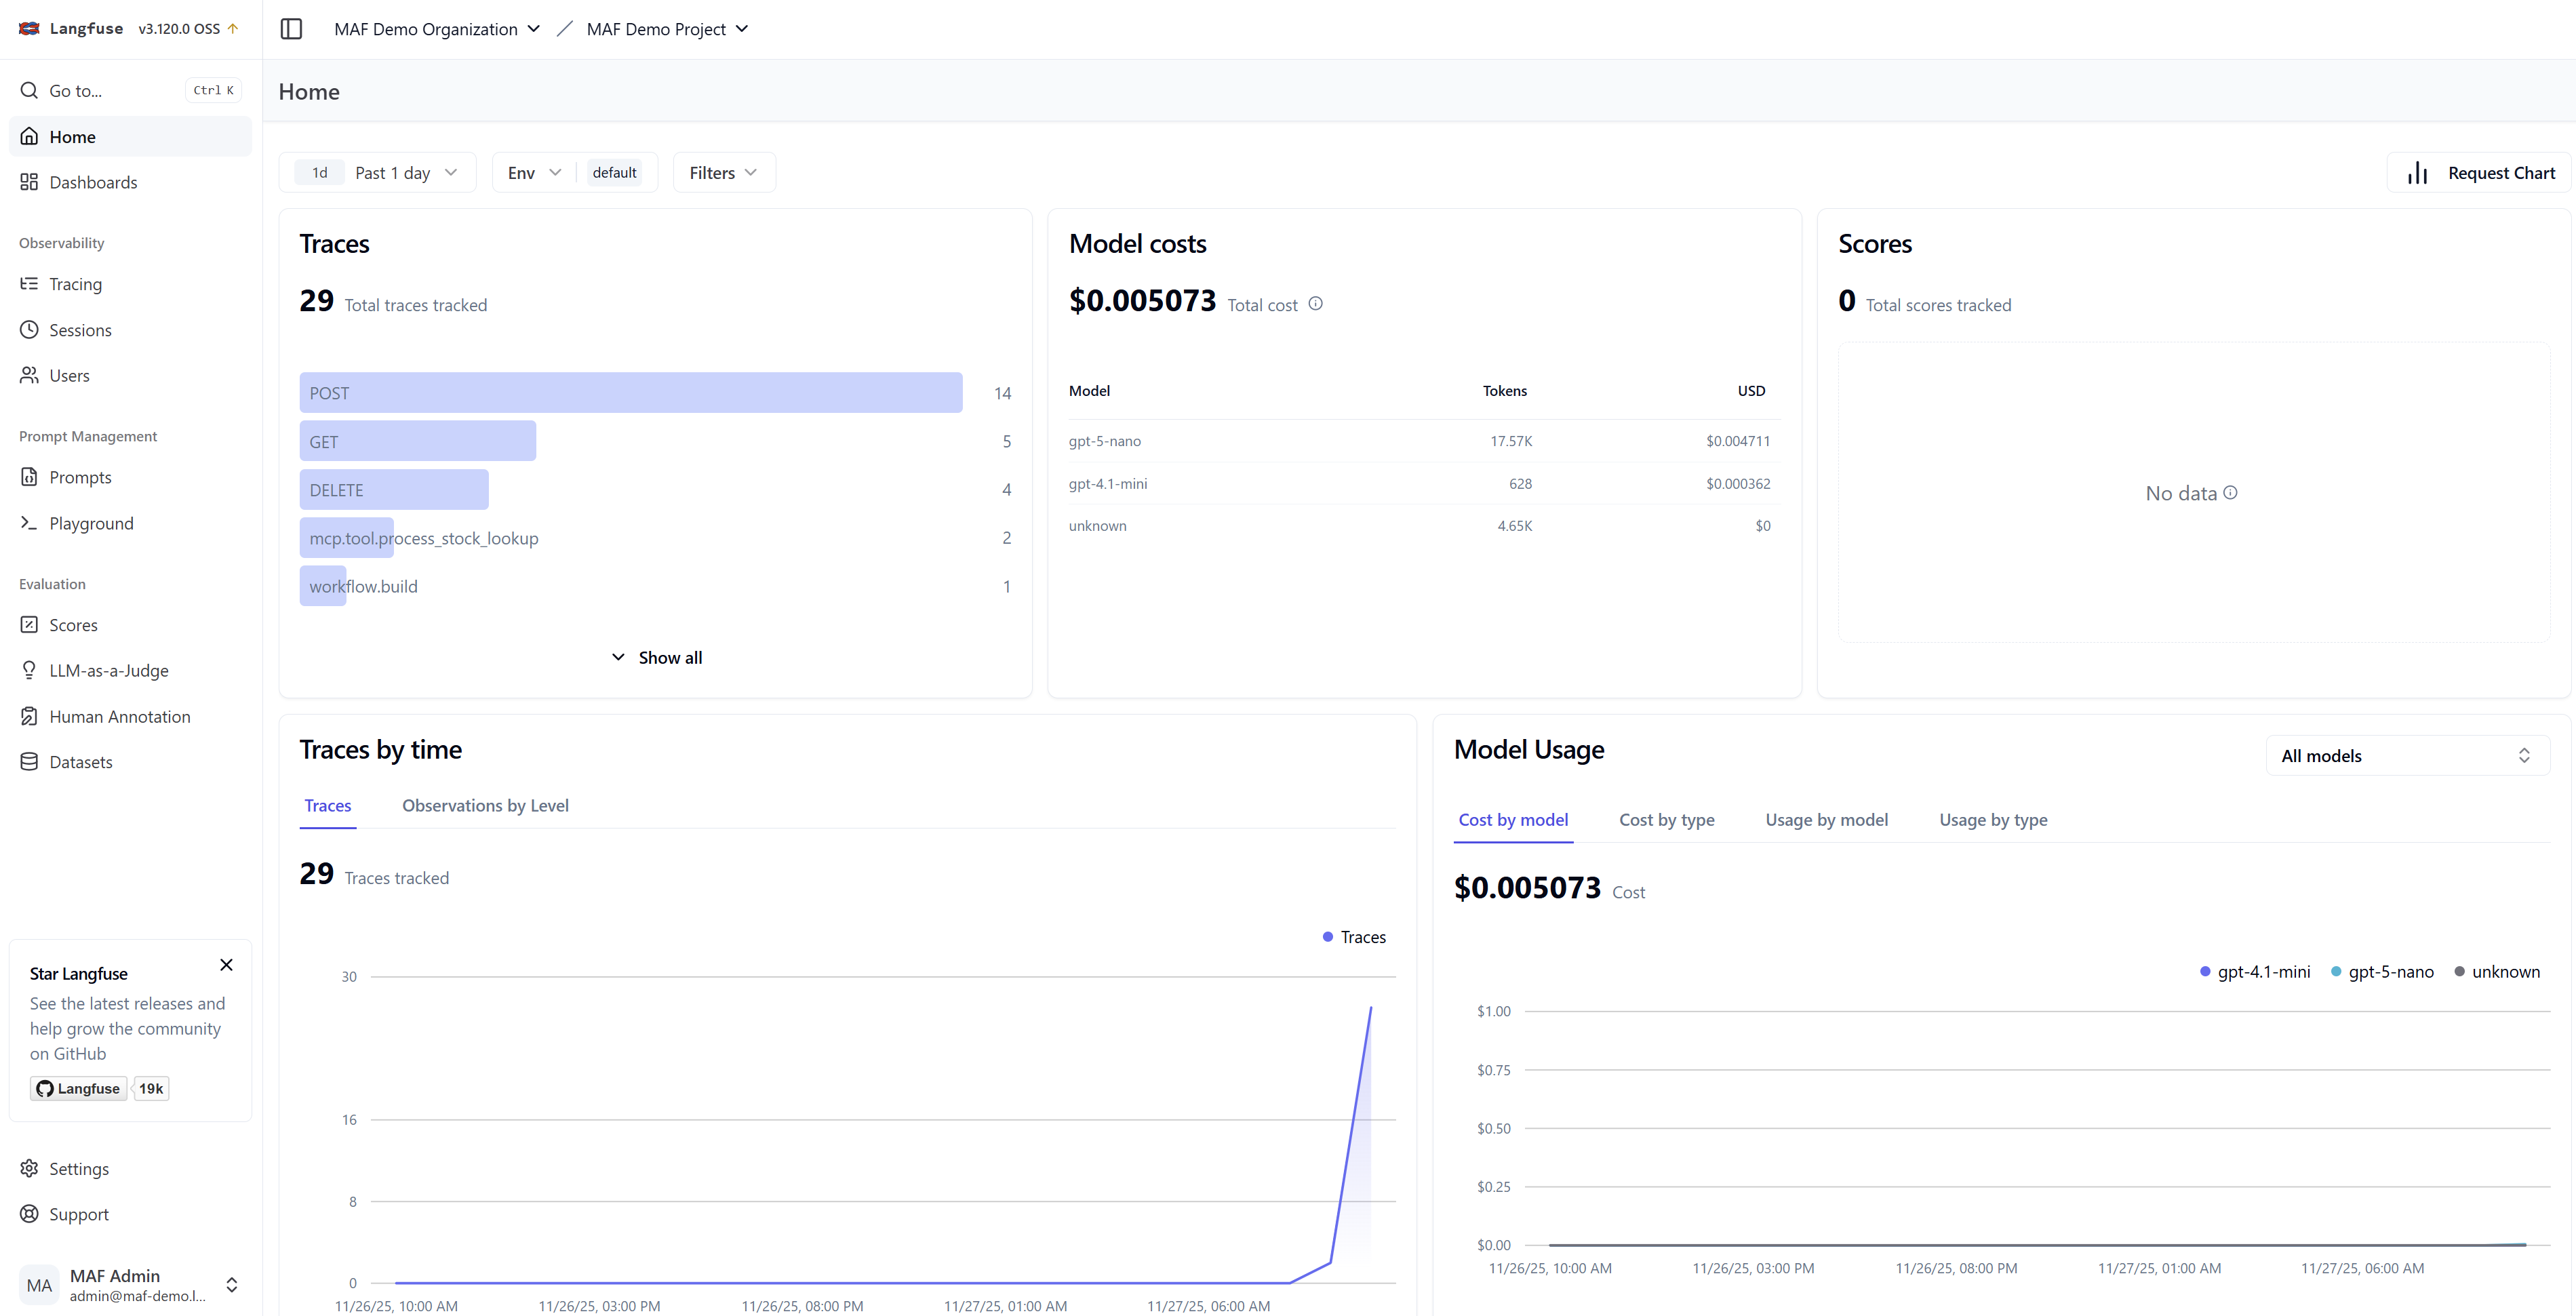
Right from the home screen you can see that Langfuse is not only about observability but also touches on the area of evaluation, which we will cover later in this series.
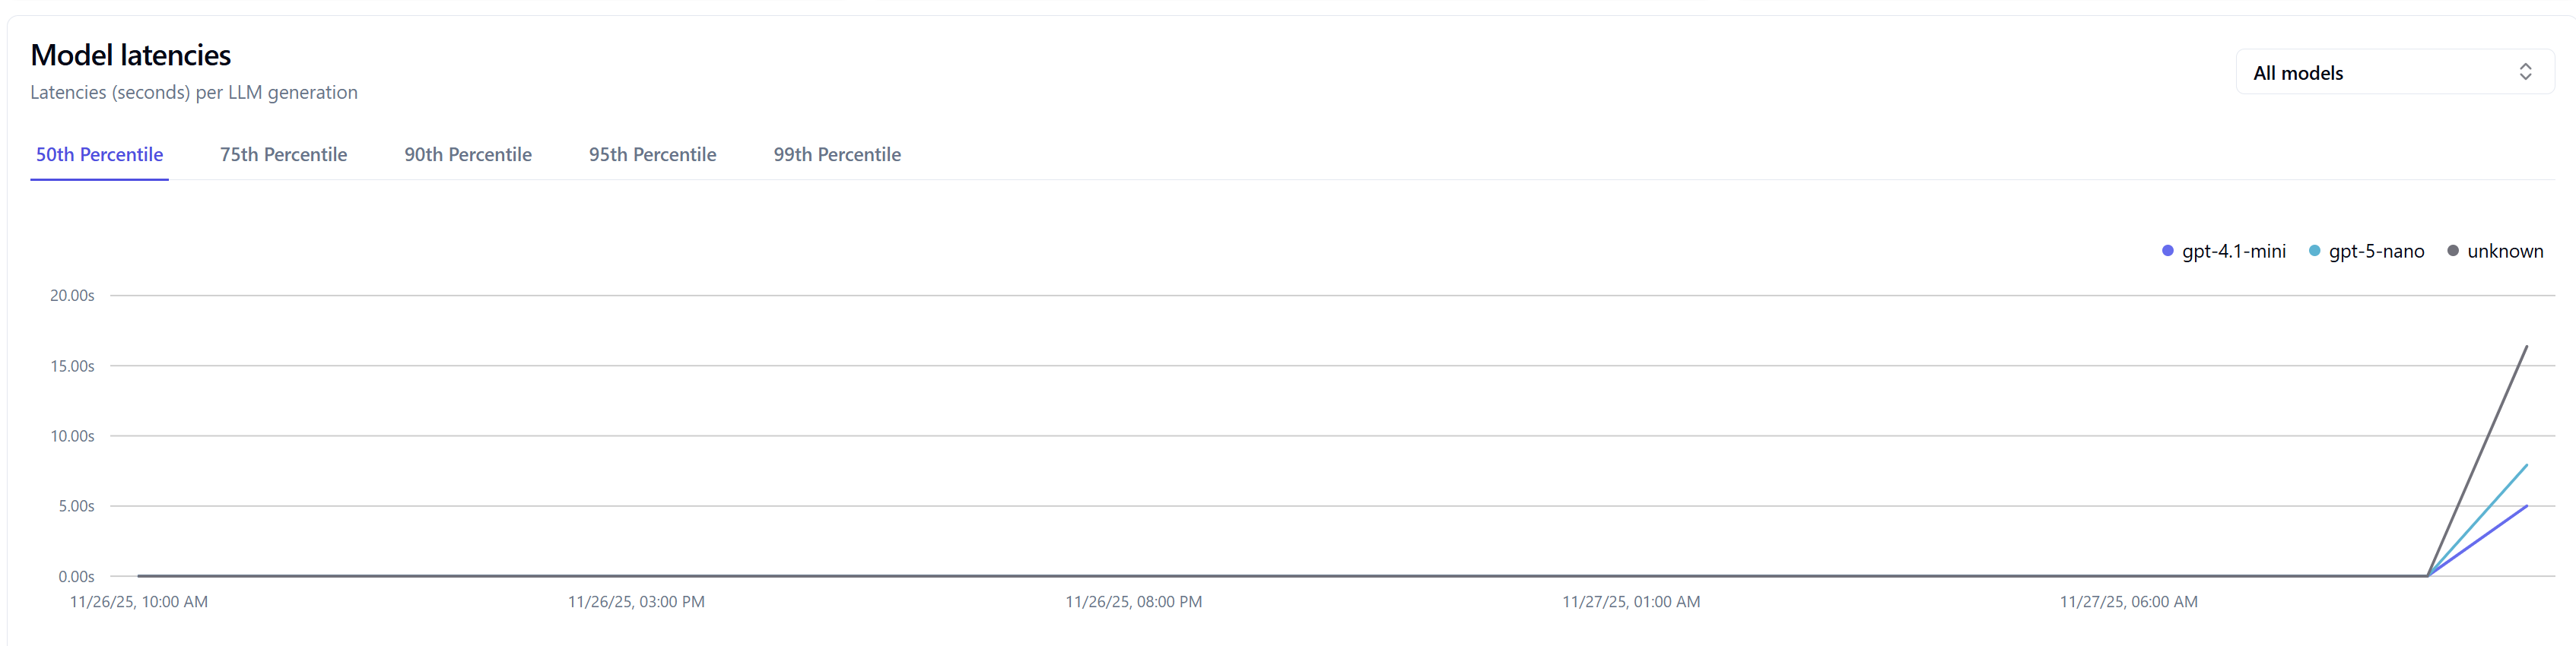
Langfuse project overviewLangfuse navigation to tracing and evaluationsLangfuse observability and datasets view
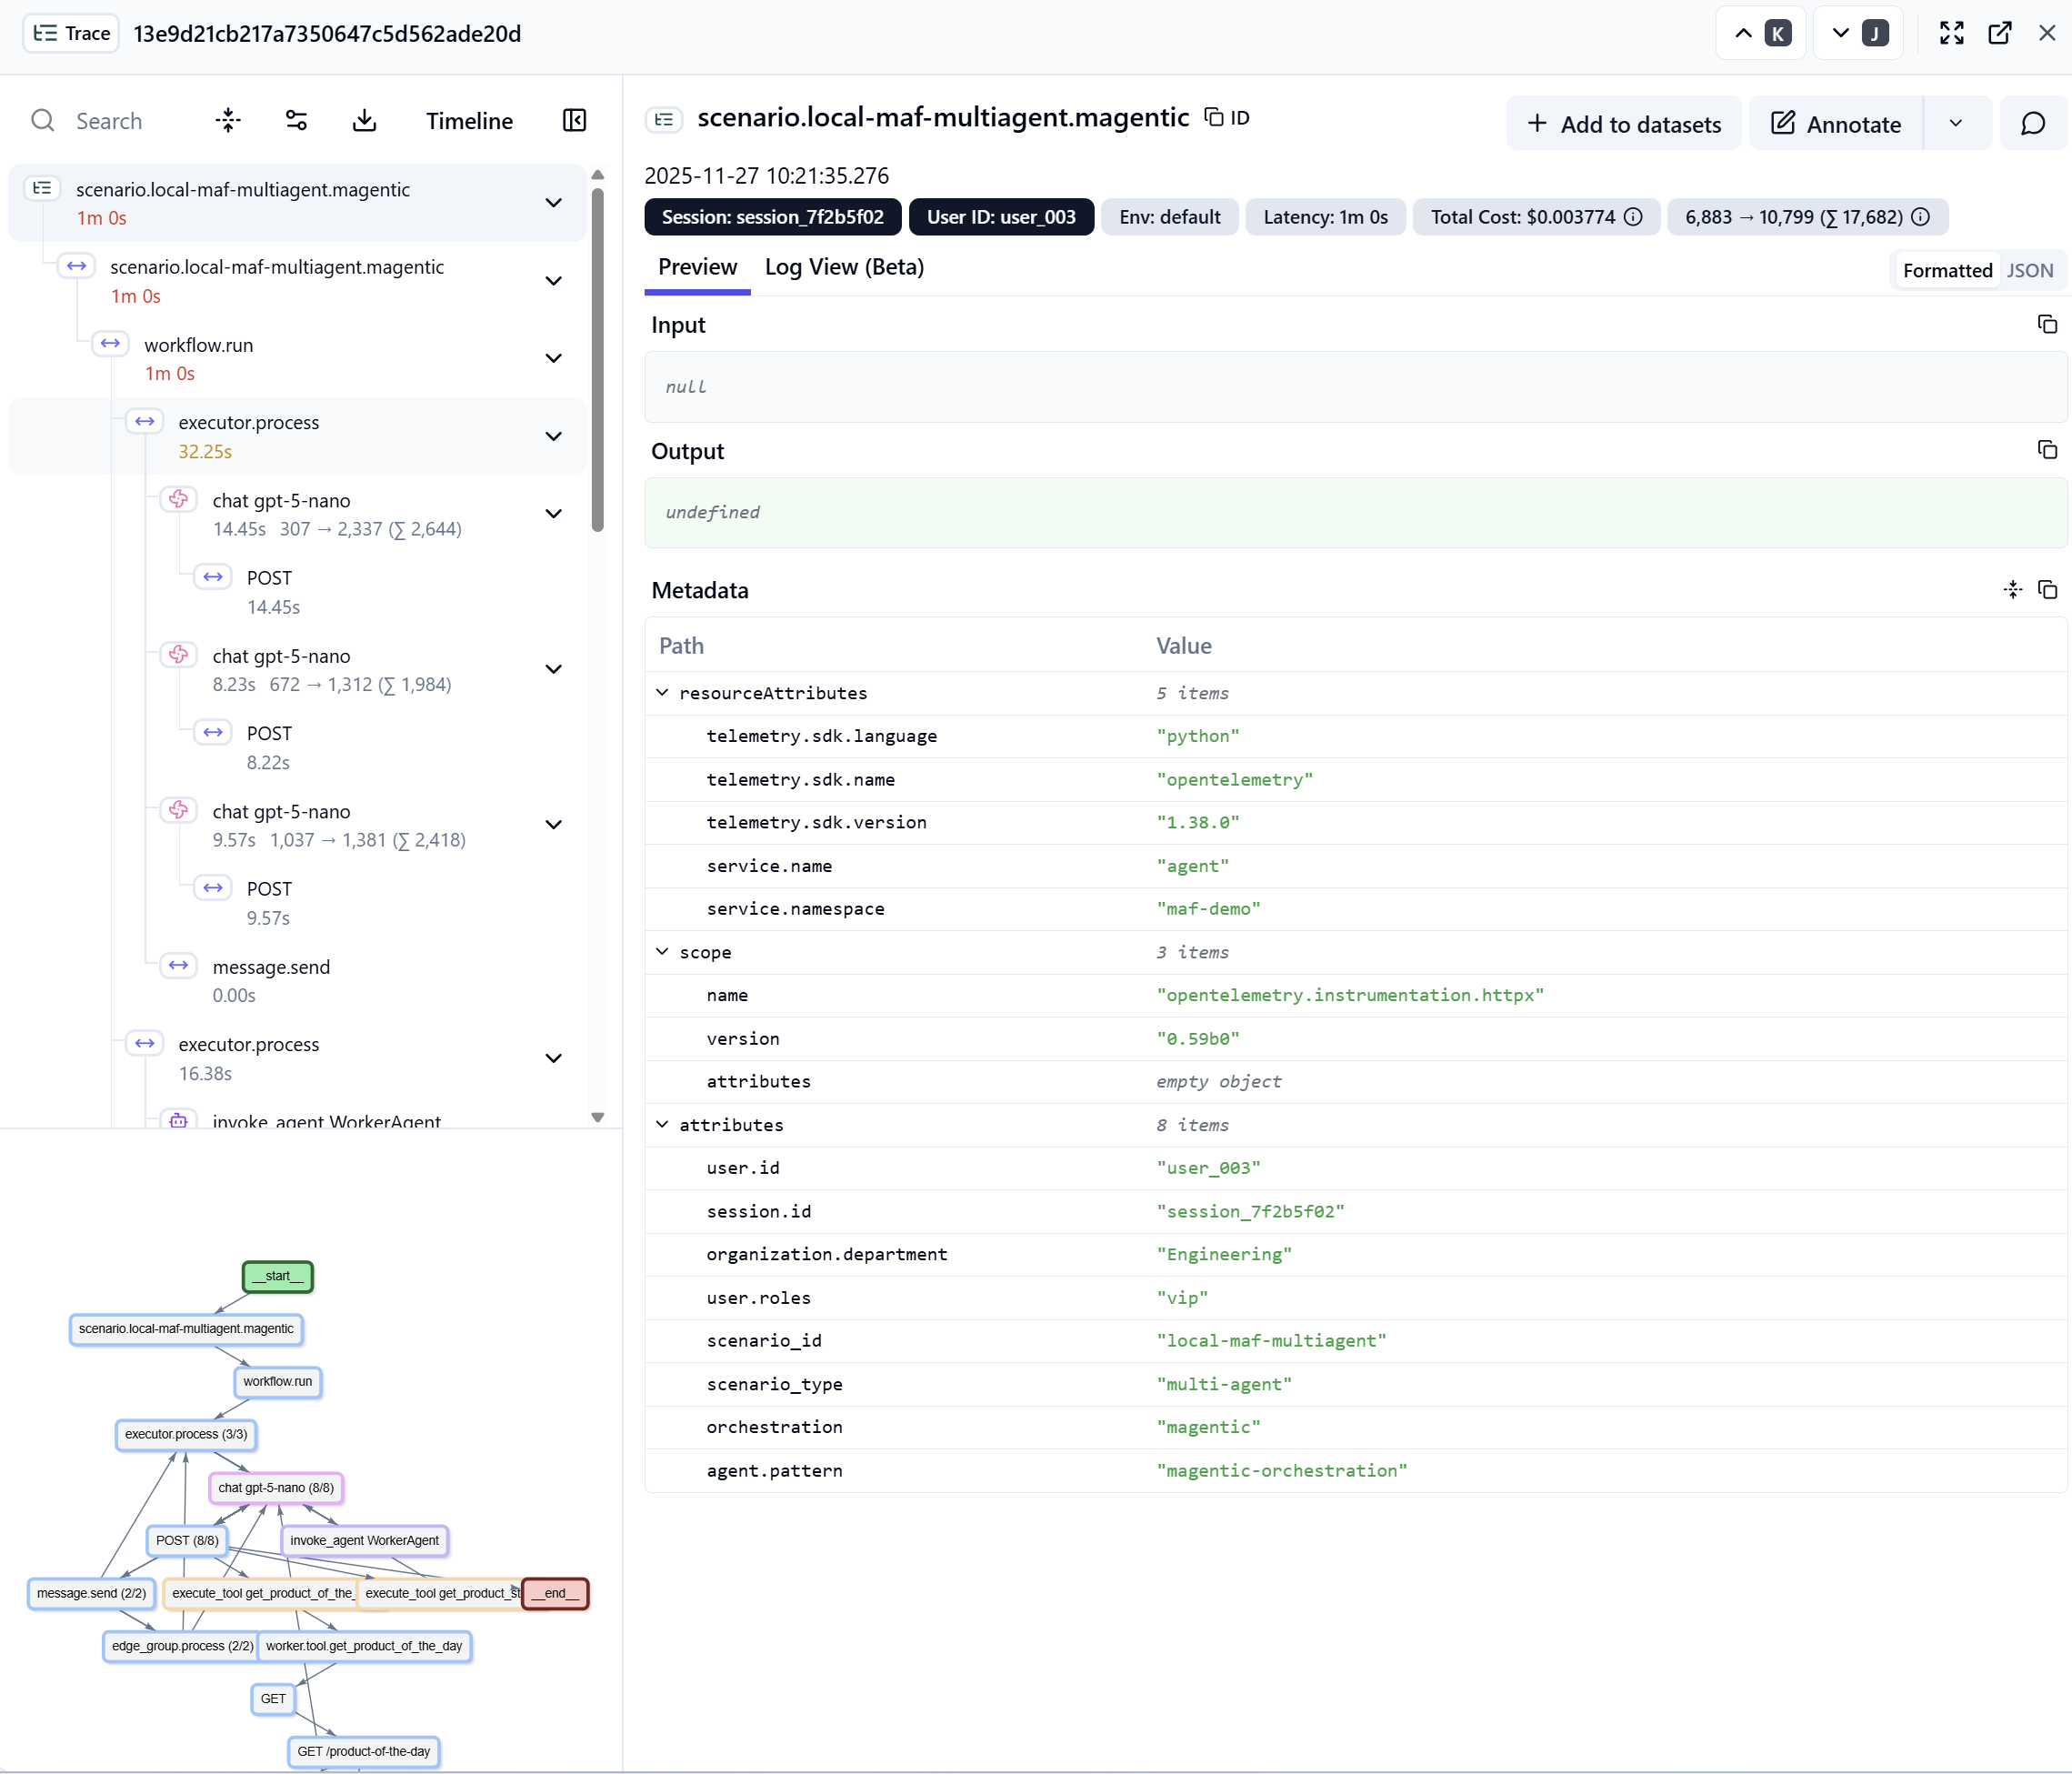
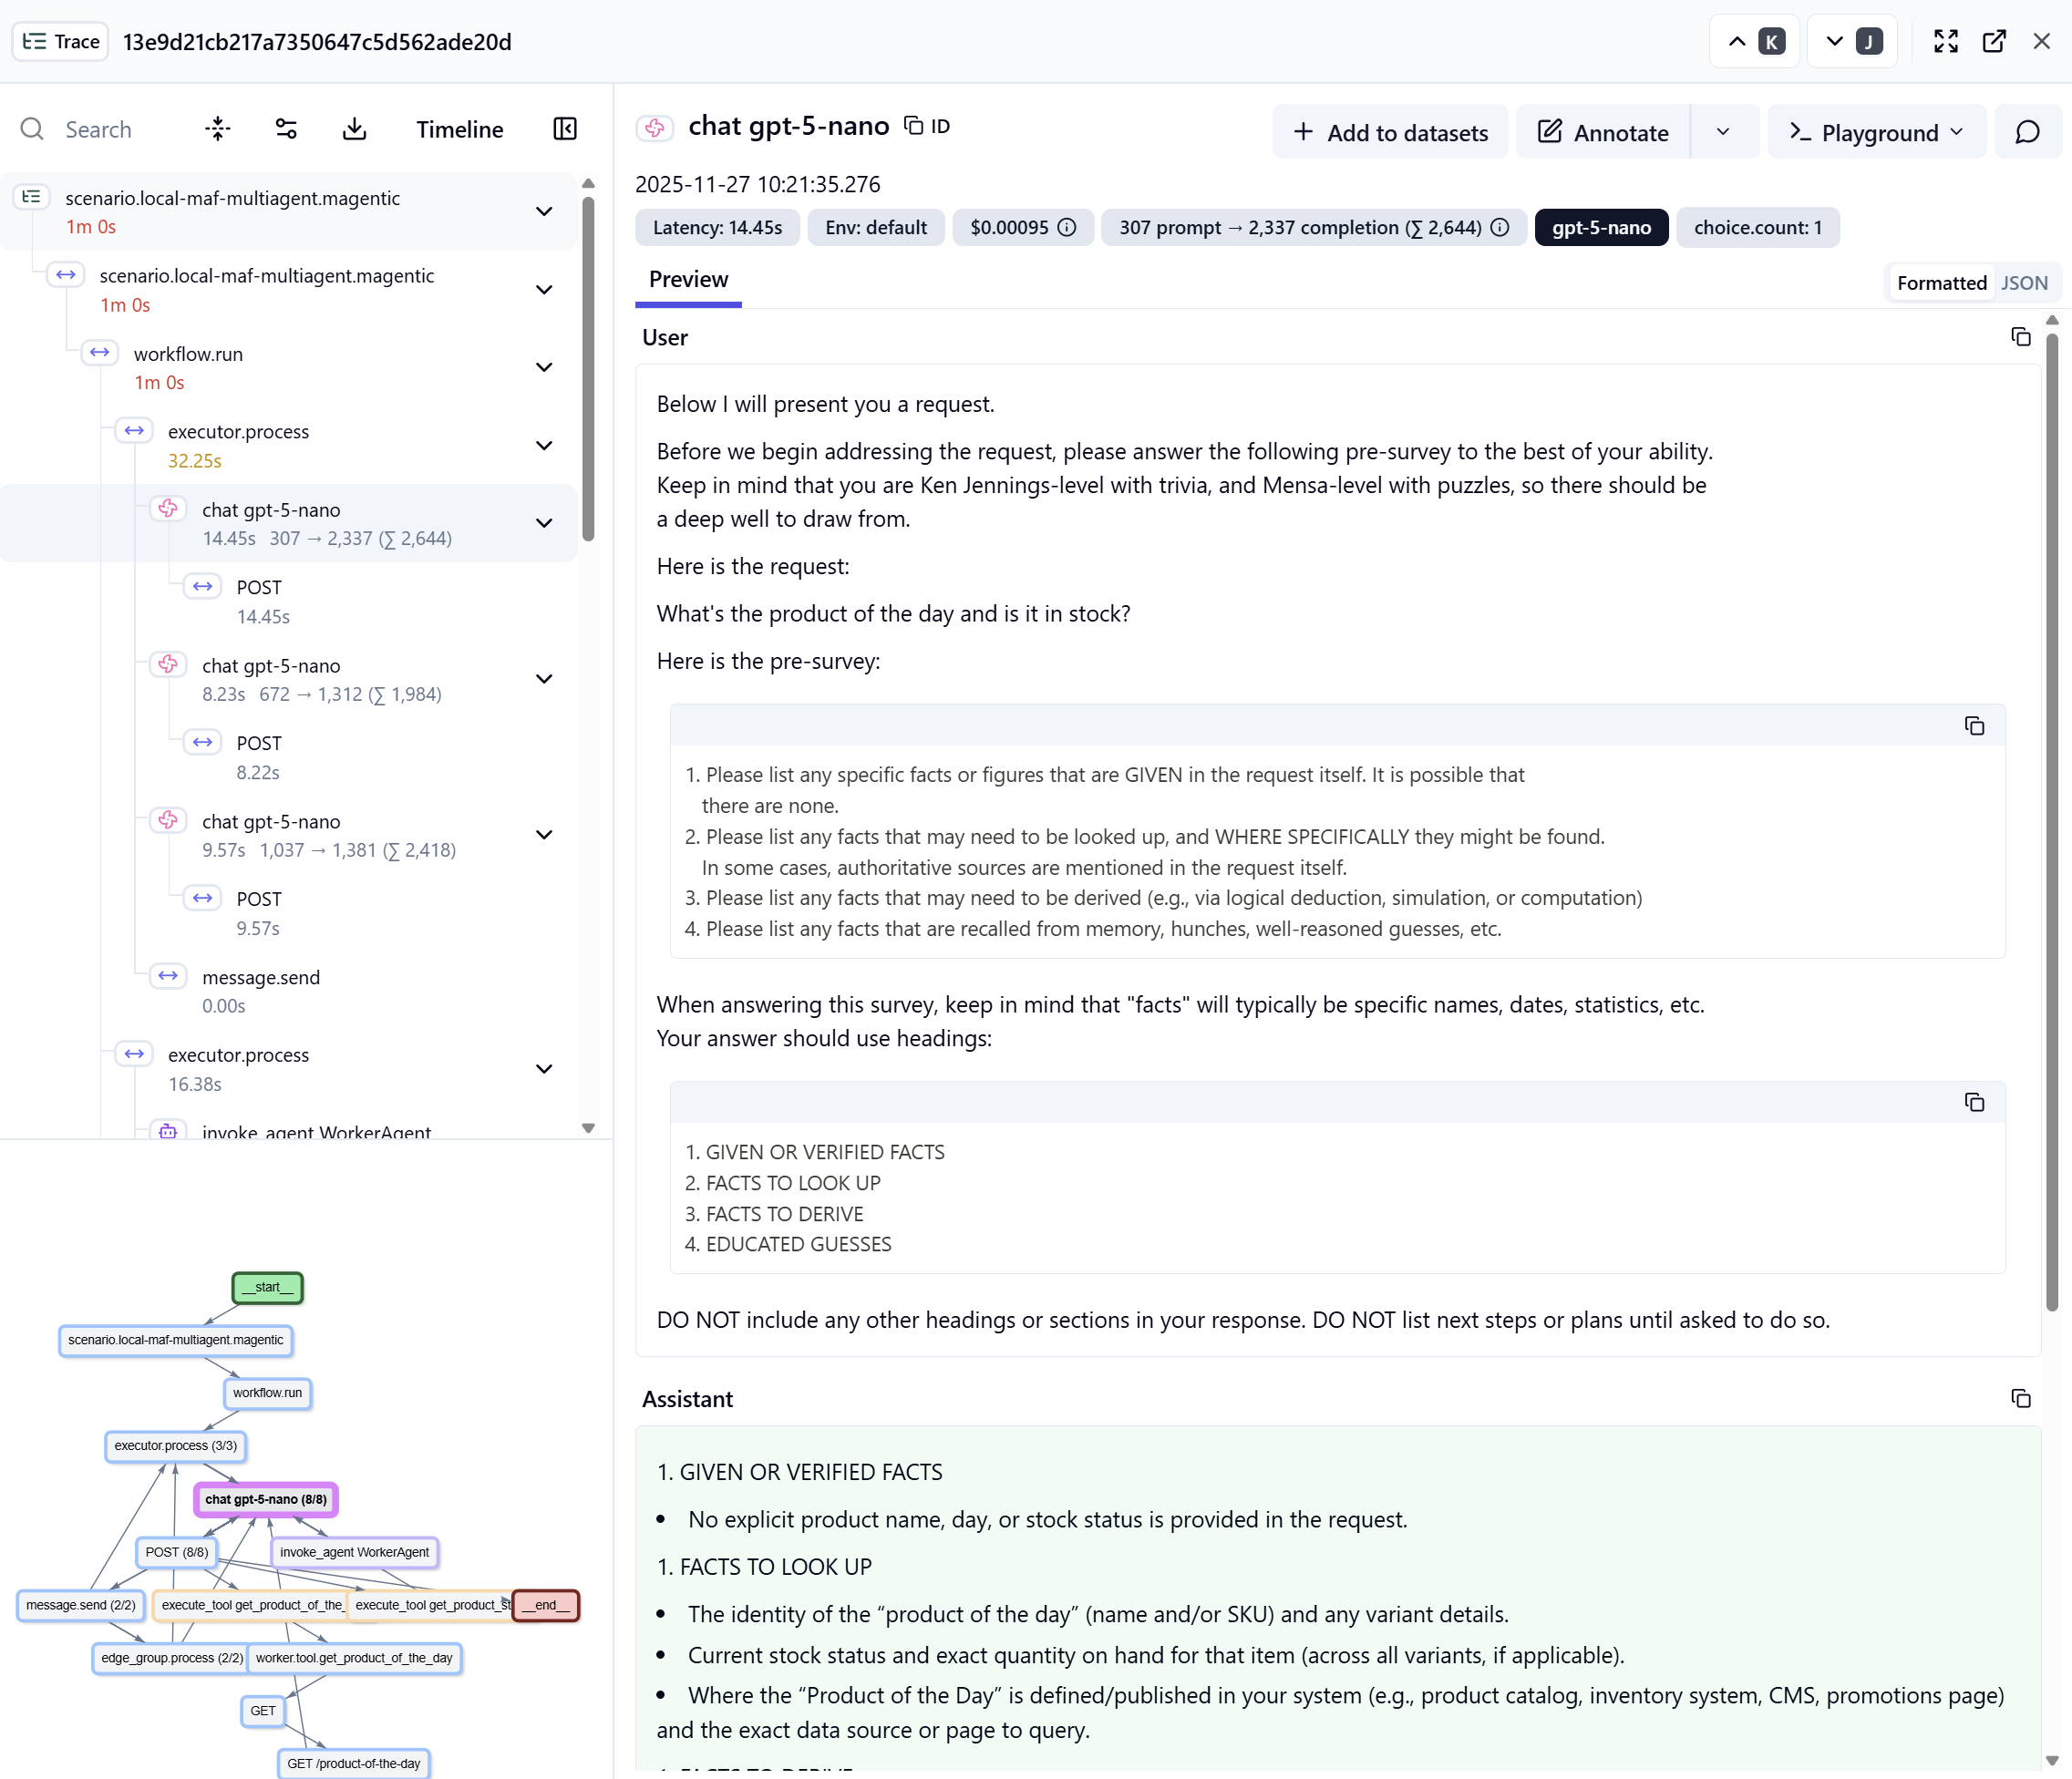
This is what a specific trace looks like - the same as what we saw in Aspire. Graphically it is different, but in principle the basic information is the same.
Concrete trace in Langfuse
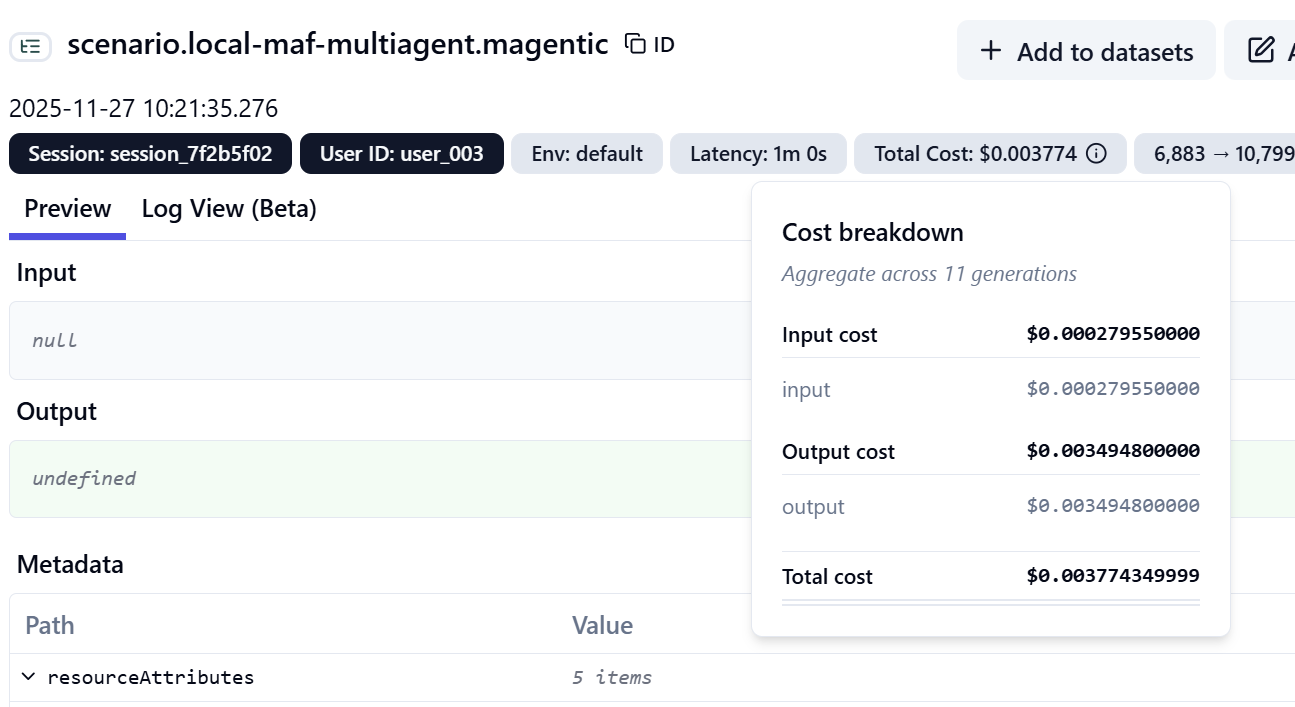
However, some things are not directly in the data but are derived - the calculation of token consumption in monetary terms is excellent.
Cost and token calculation in Langfuse
Of course we can again nicely see the conversation itself.
Conversation in a Langfuse traceMessage detail in a Langfuse trace
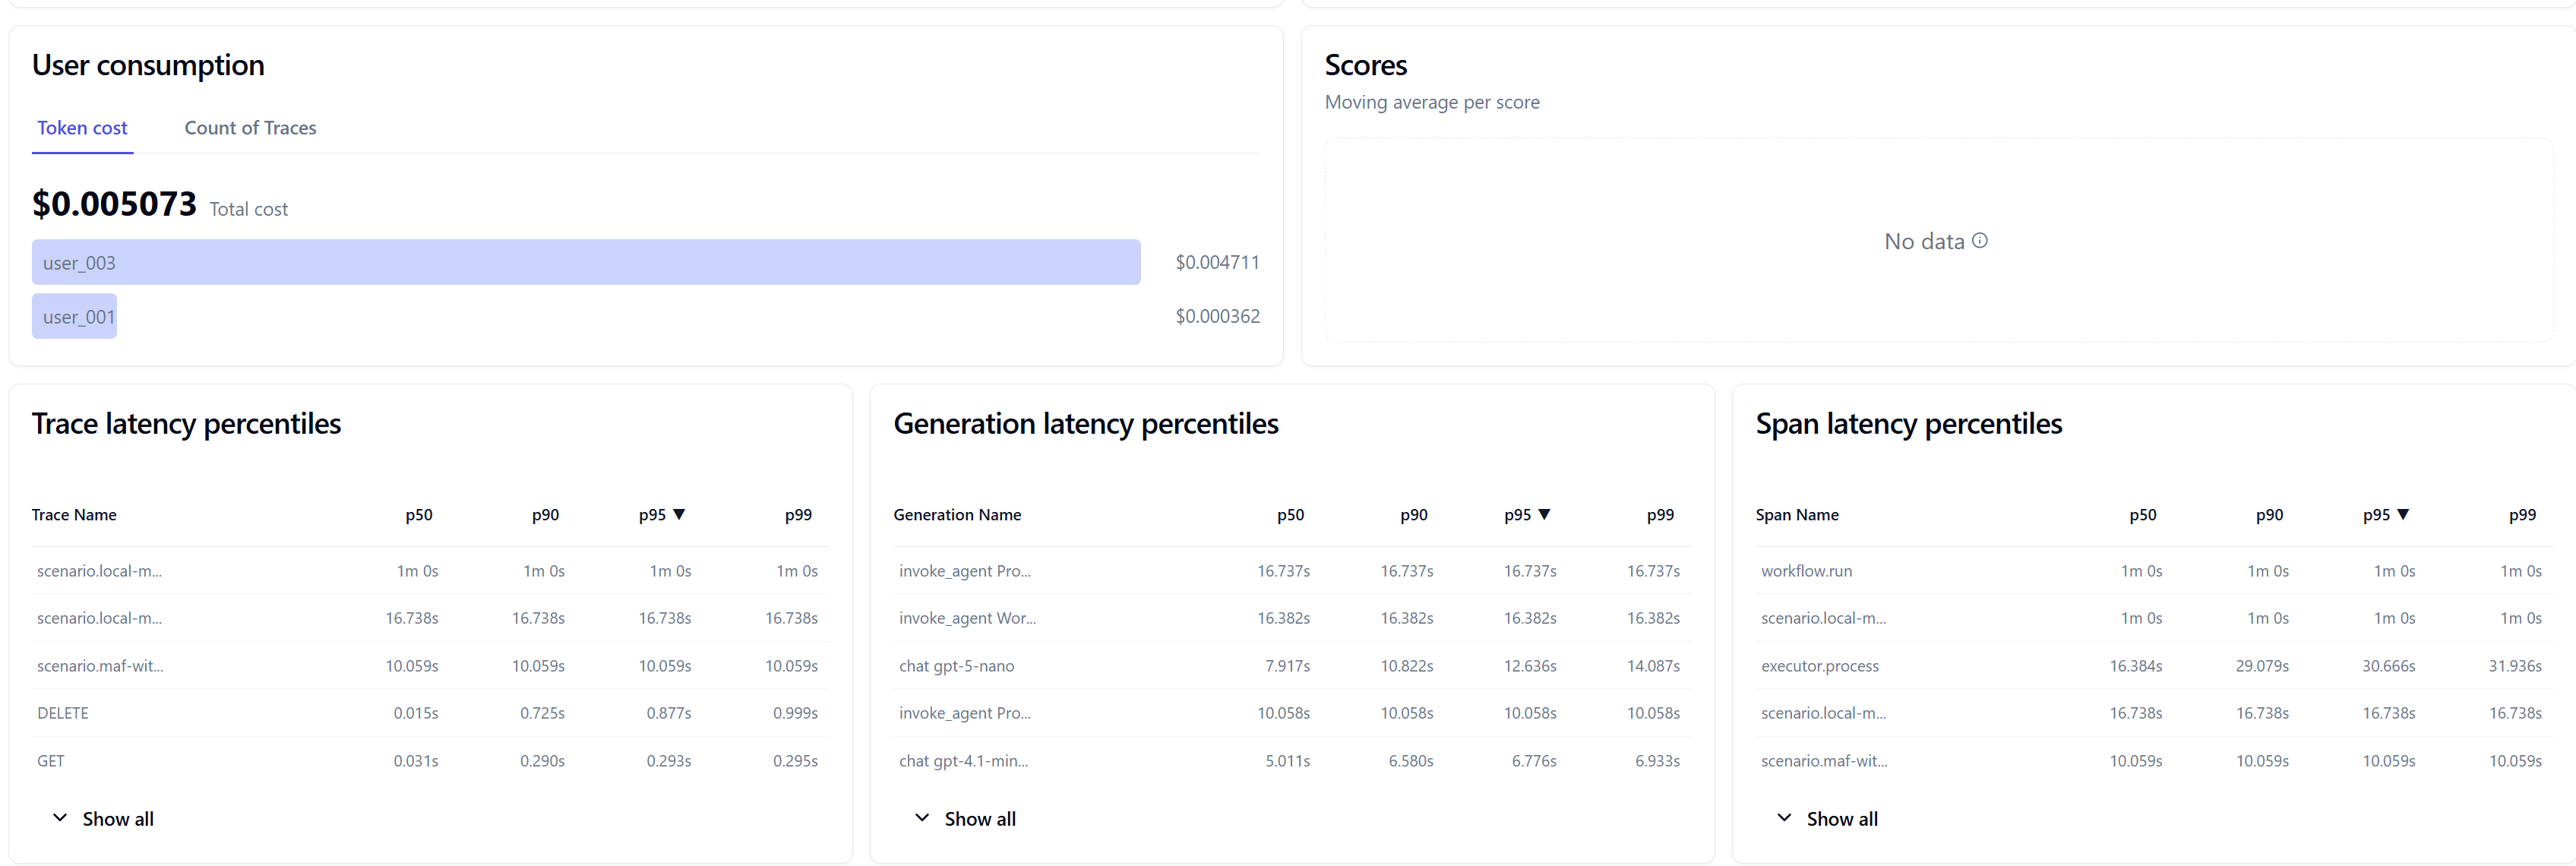
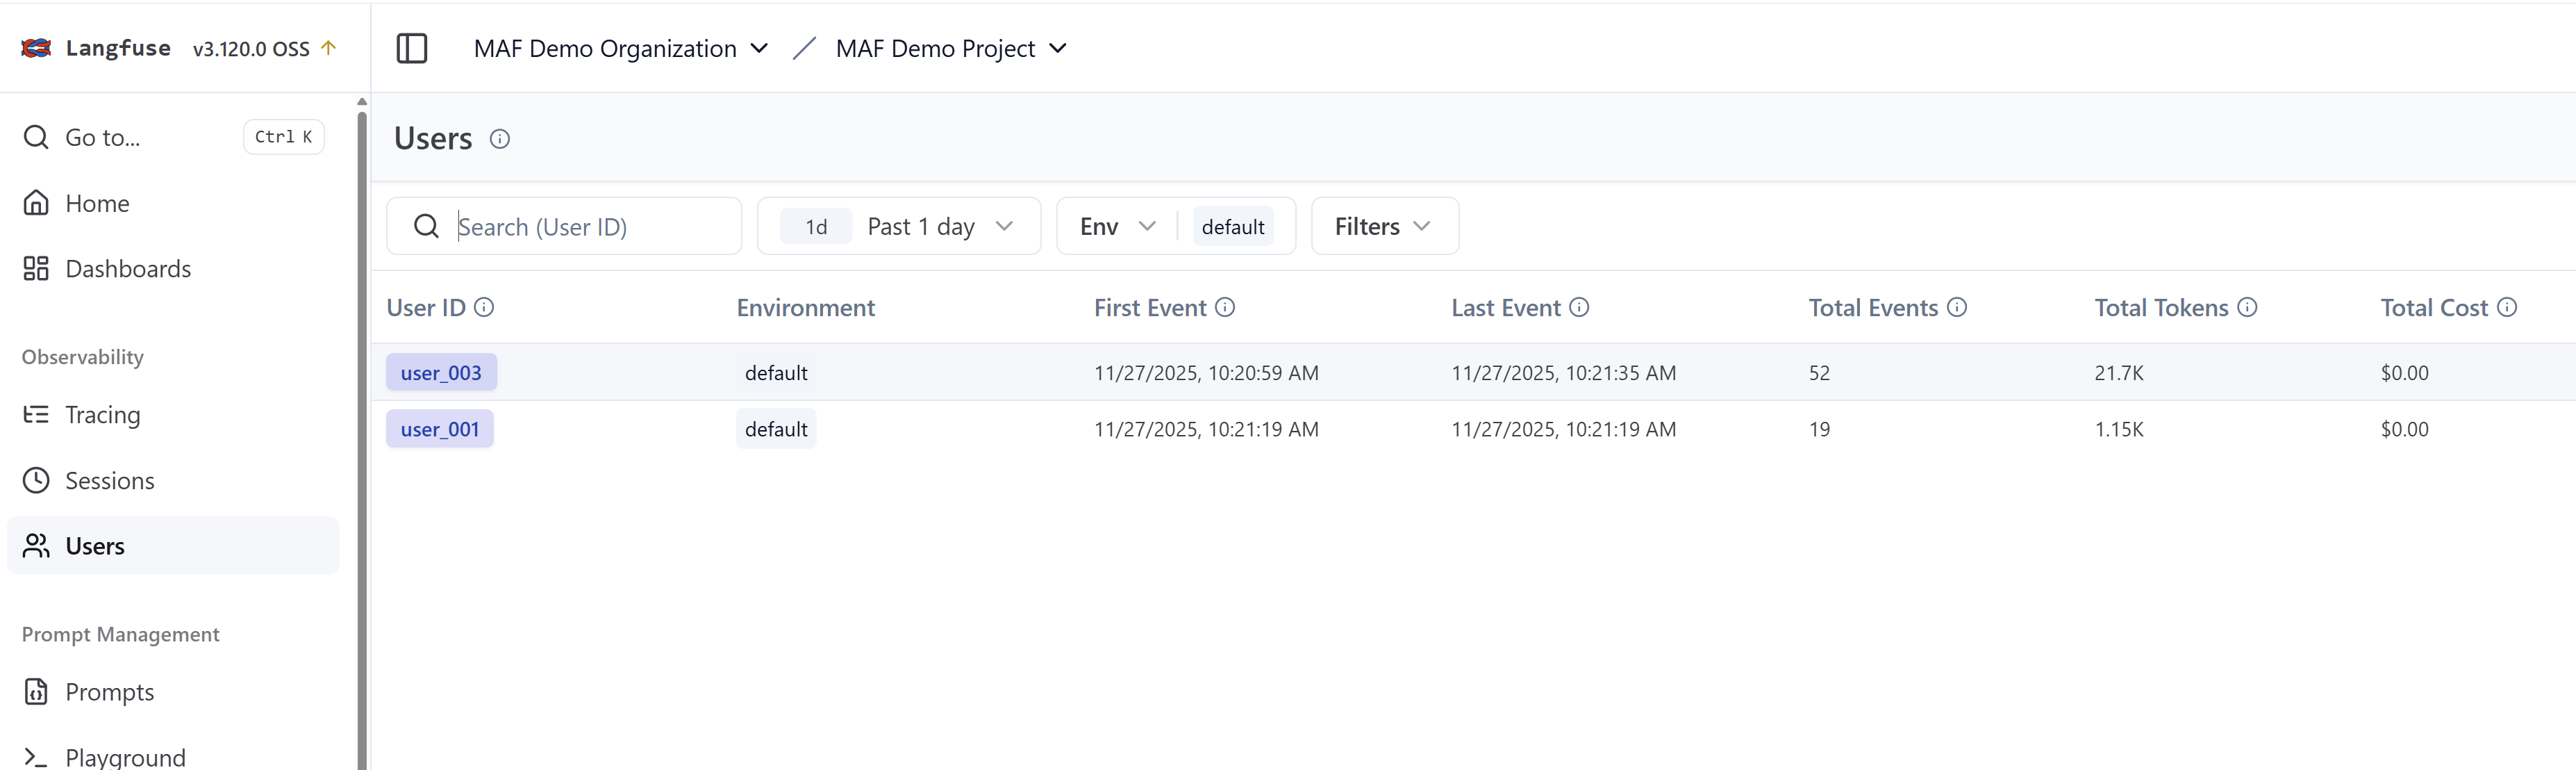
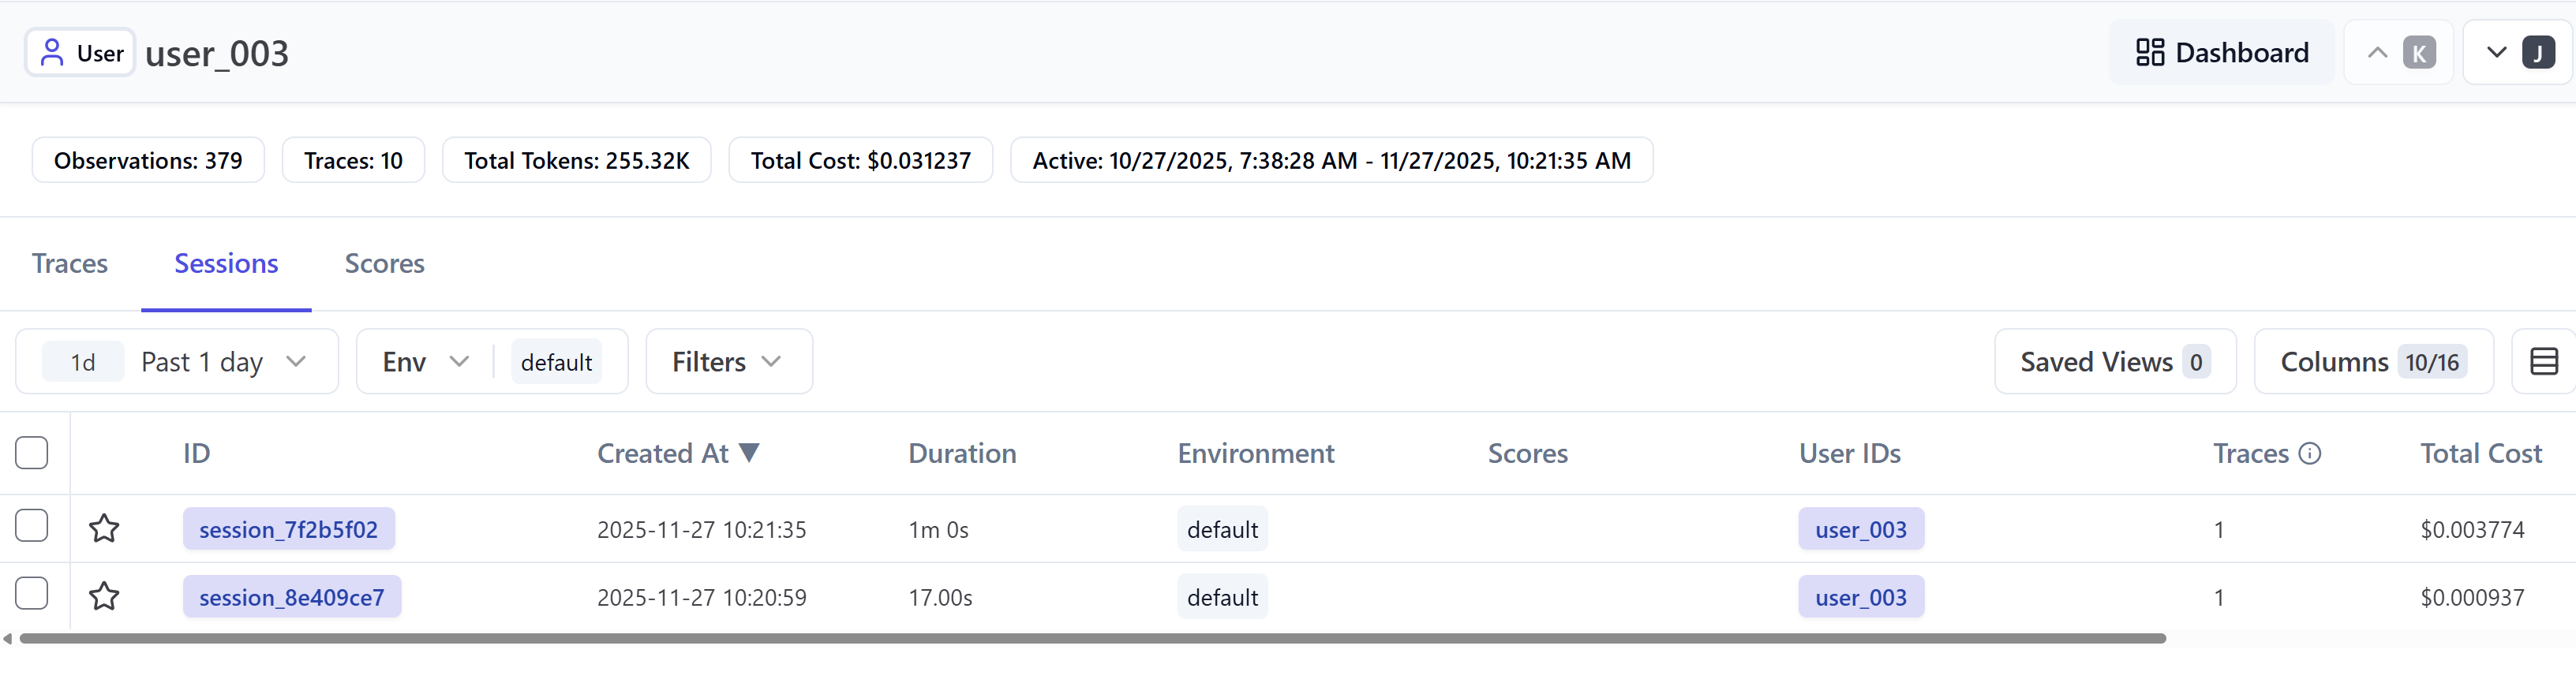
Langfuse directly parses some well-known parameters, for example user ID. This allows it to immediately provide an overview of users and their token consumption.
User overview and token consumption
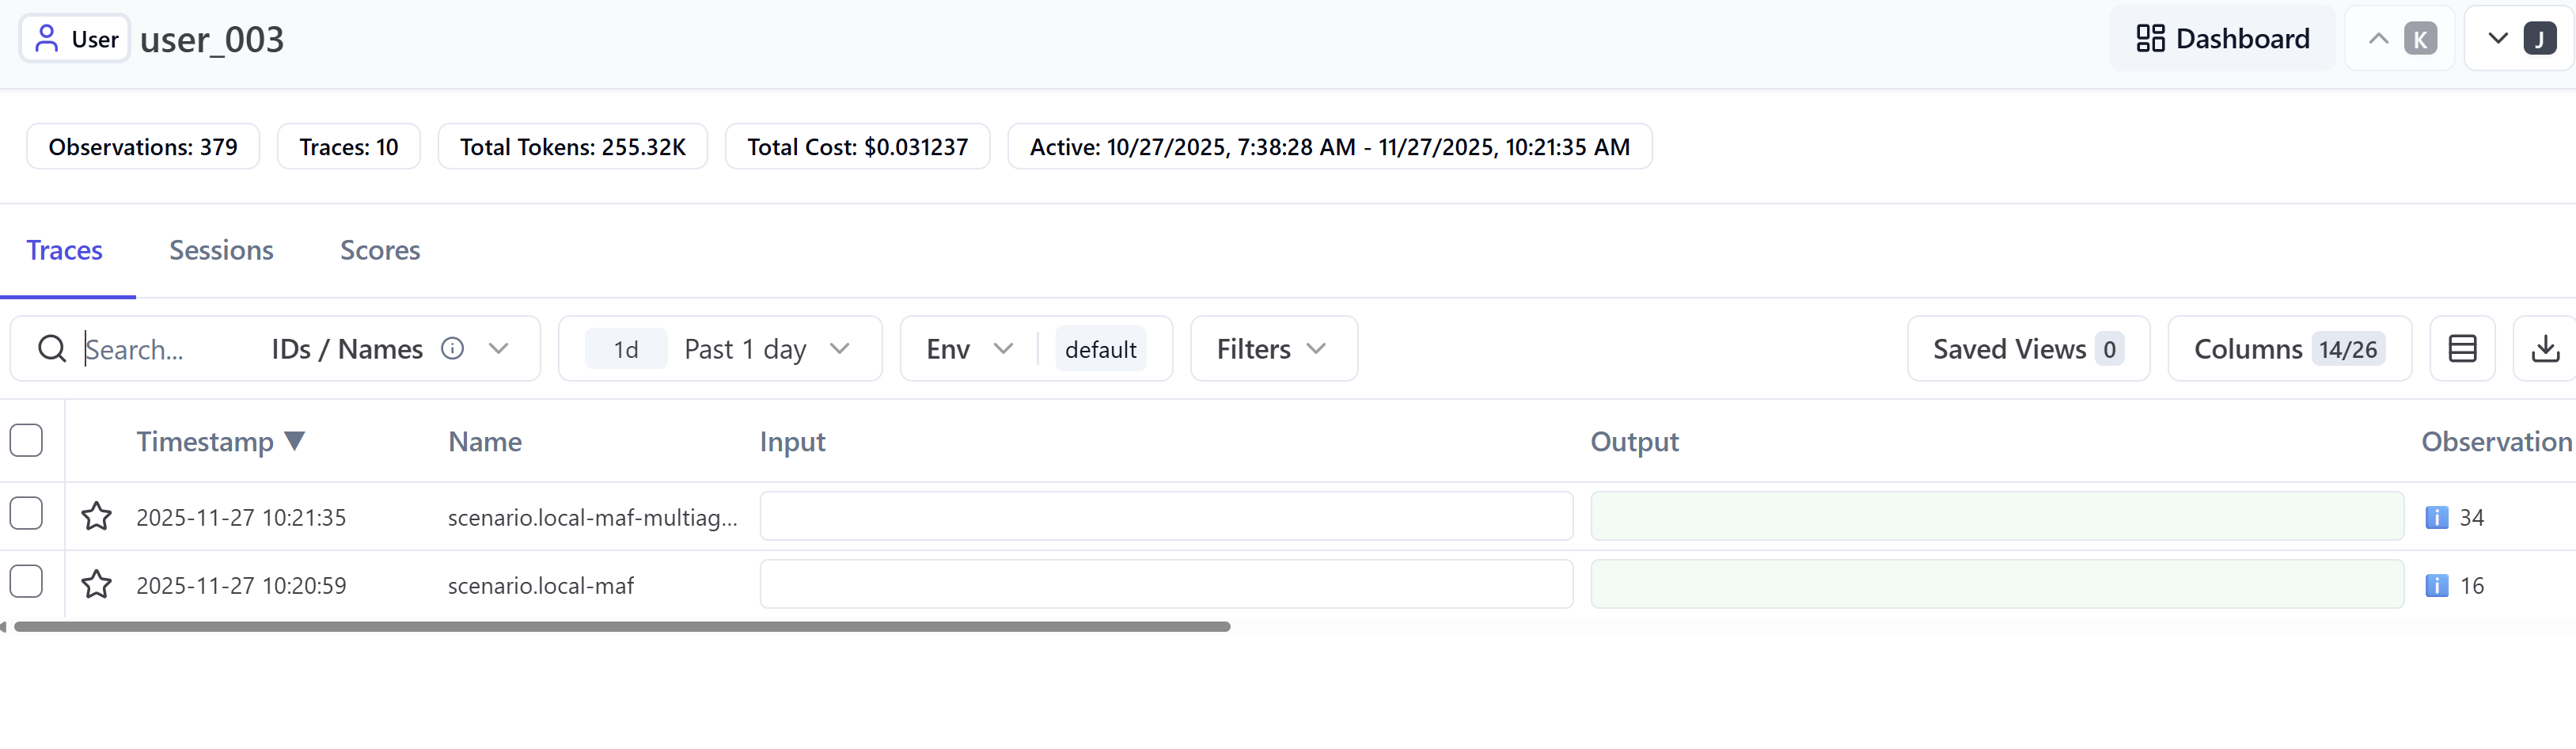
From there you can drill down and see individual traces, sessions, and so on.
User detail and sessions in LangfuseIndividual traces in a session
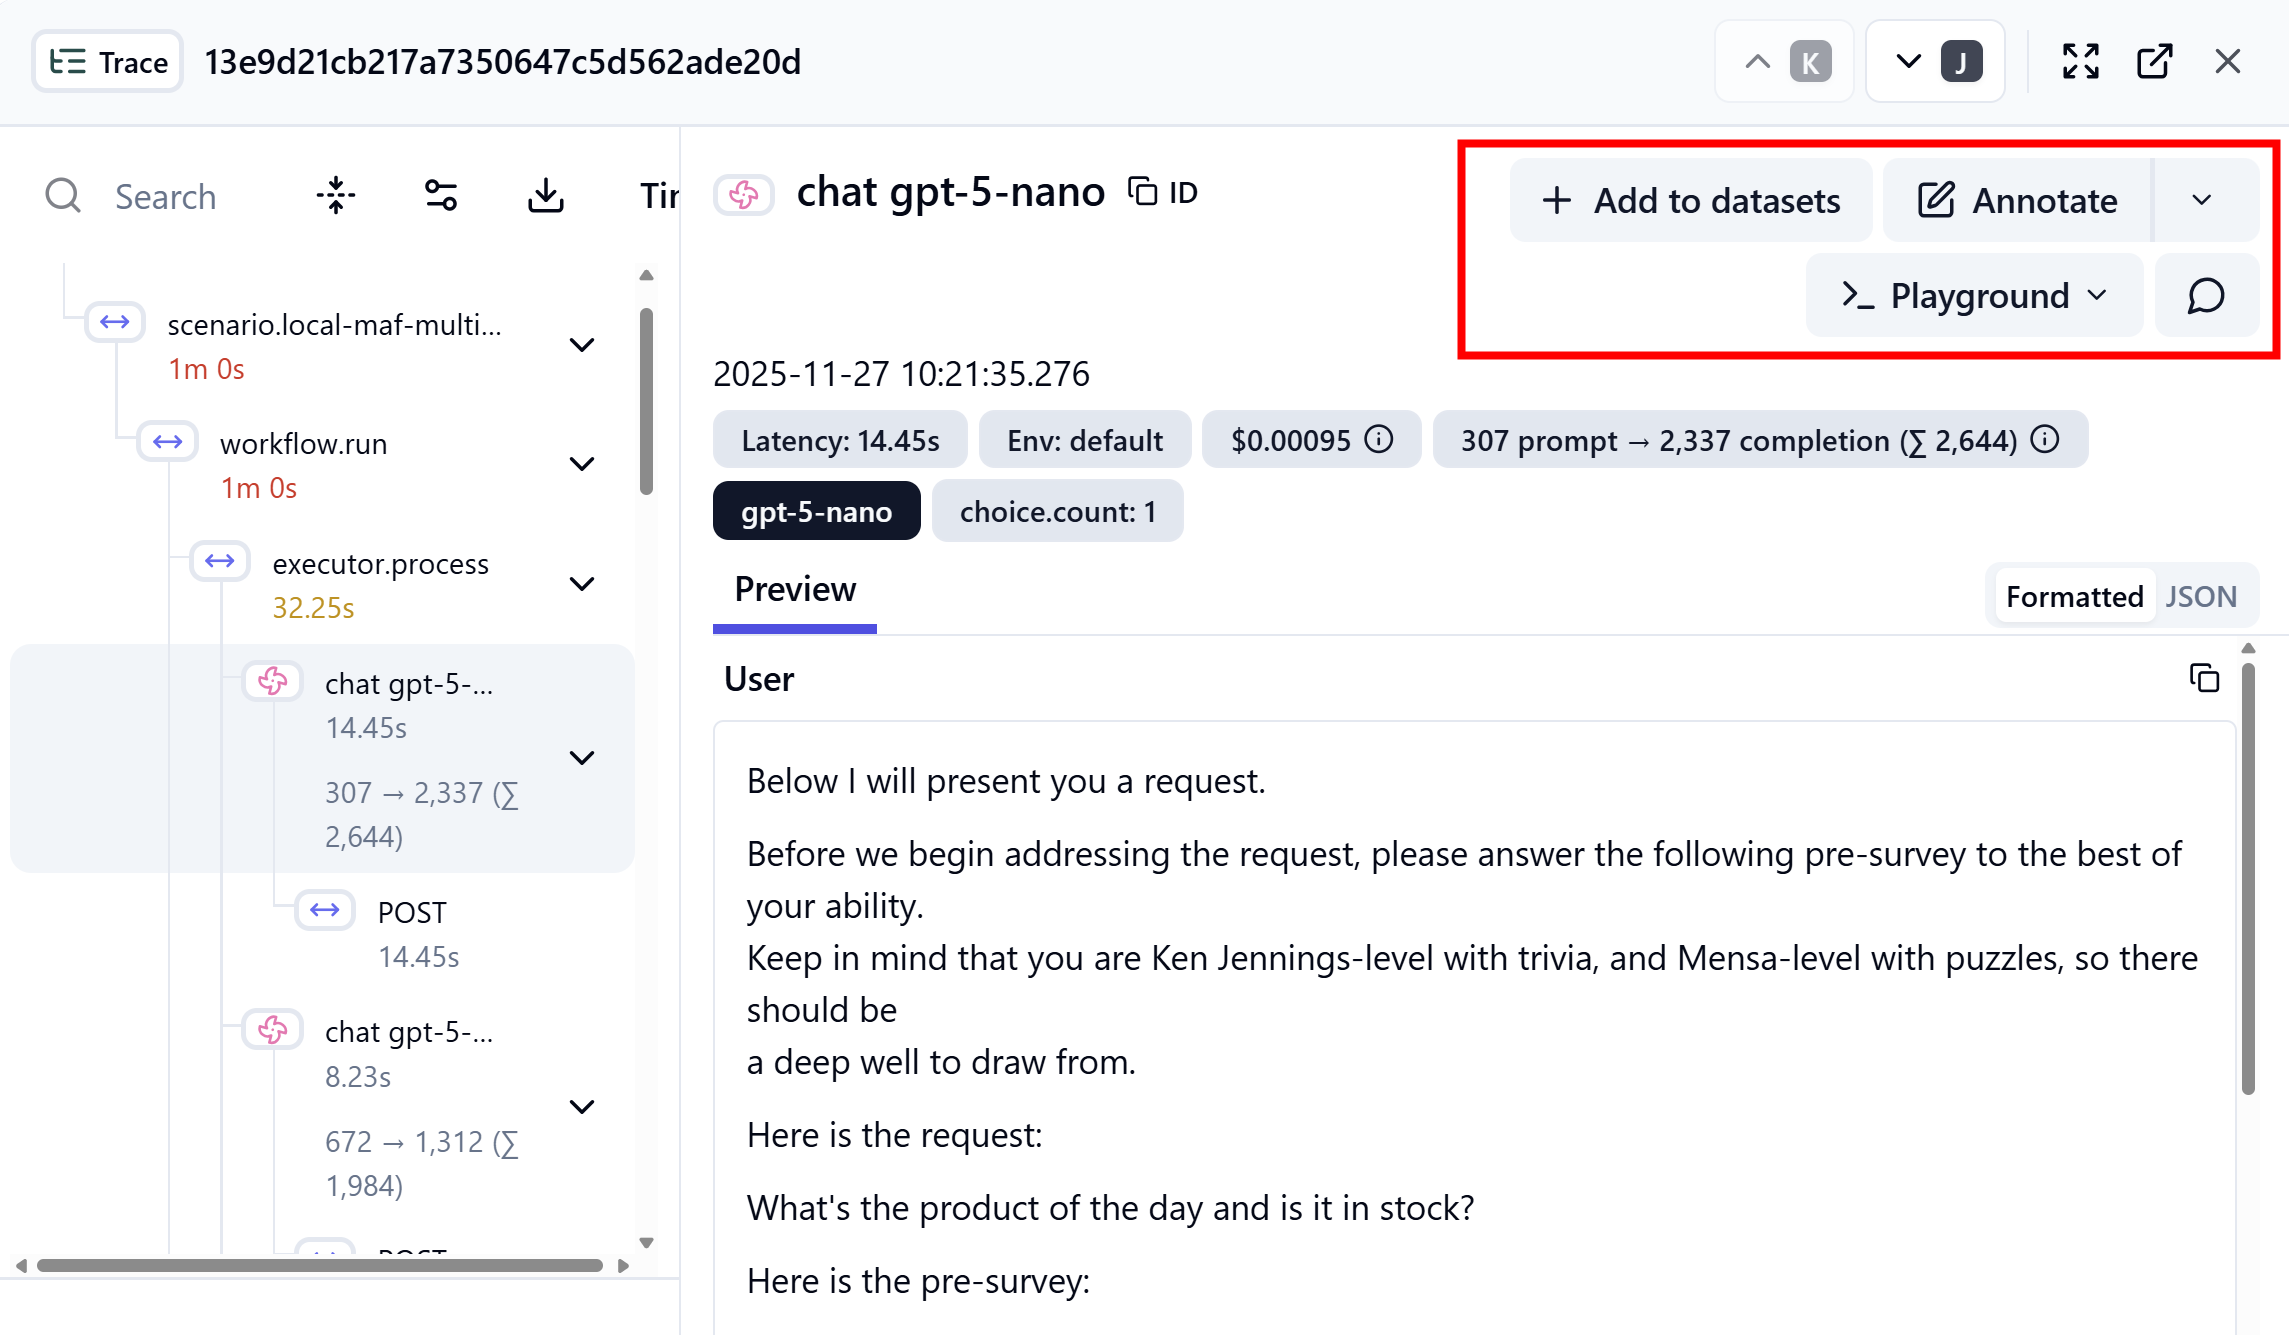
Langfuse also goes into evaluations, but we will discuss that later. You can take a captured conversation, add it to some dataset, annotate it, try it in a simulator, and so on.
Langfuse datasets and evaluation
For me, Langfuse is the best tracing tool specifically focused on AI in the open-source category. Even though it is not fully open in terms of governance, it is my first choice when I have to stay in the self-managed world. Its evaluation capabilities we will discuss later and it has its place there too, even though projects like DeepEval are strong, albeit somewhat differently focused, competition.
Today we dove into open-source options - Aspire for quick developer snapshots, Langfuse as an open-source specialized AI solution. Further alternatives lie in using non-specialized developer tools and in hosted solutions focused on AI scenarios. We will look at those next time - Azure Monitor and Azure AI Foundry.
Aspire Dashboard
small, fast, and excellent for a developer view nearly in real time.
Anonymization
the same telemetry stream can be sent via the OTEL collector once fully and once sanitized.
Langfuse
specialized AI observability tool with tracing, token economics, and a link to evaluations.
Tool choice
Aspire for quick troubleshooting, Langfuse as a self-managed AI tracing option.
The next step is to look at service-based variants - Azure Monitor and Azure AI Foundry.